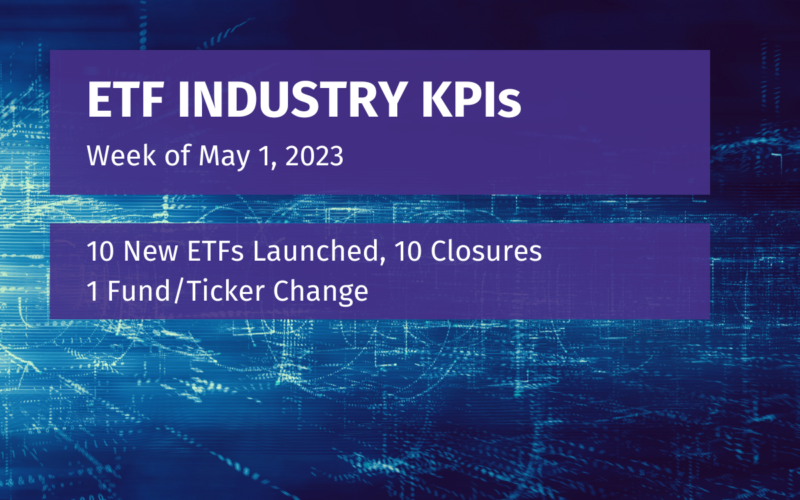
Week of May 1, 2023 KPI Summary
 Ryan Fitzgerald
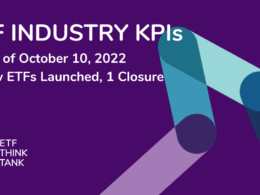
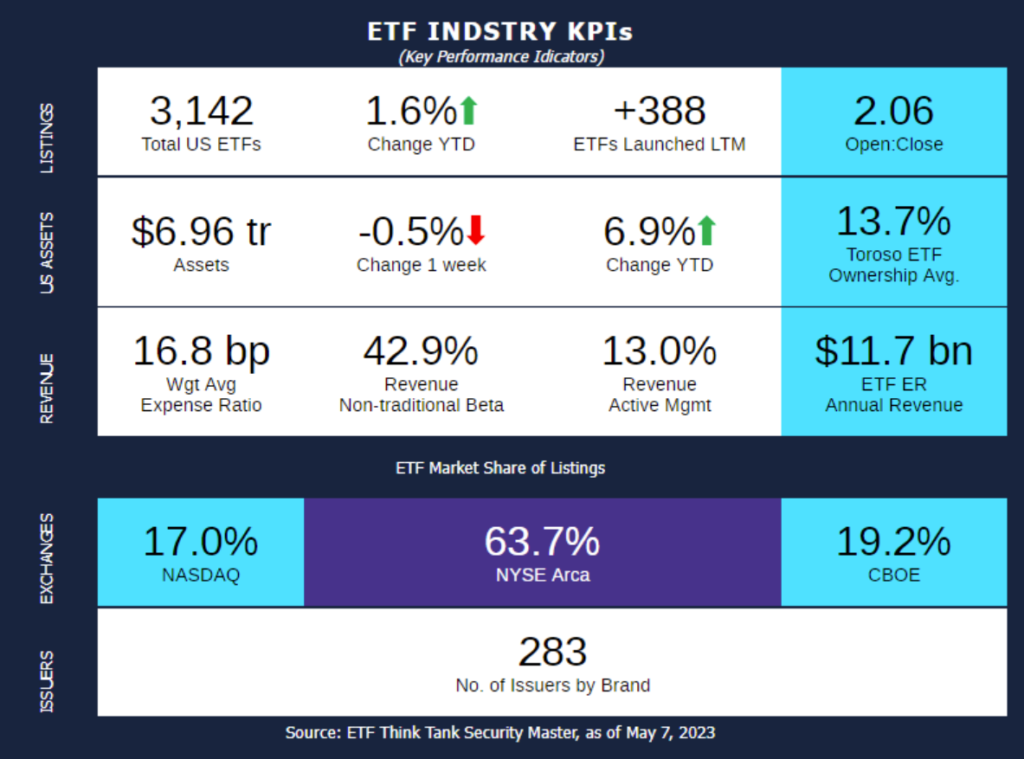
- This week, the industry experienced 10 ETF launches and 10 closures, shifting the 1-year Open-to-Close ratio to 2.06 and total US ETFs to 3,142.
- The month of May has arrived, and for millions of high school and college students across the United States, May means graduation! Most students take 4 years to graduate, so we are going to examine the top ETFs that were launched in 2019.
- 187 ETFs are still open that were launched in 2019, totaling $68.8 Billion, which is about 1% of the ETF industry total AUM.
- Equity ETFs make up 52% of the funds and 61% of the AUM. Additionally, Fixed Income is 22% of the funds and 21% of the AUM.
- The largest fund by AUM of 2019 is currently Avantis U.S. Small Cap Value ETF (AVUV) at approximately $5.3 Billion. The next 4 in order are SCHI, AVUS, BBIN, and SUSL.
- The largest fund that is not Equity or Fixed Income is RPAR Risk Parity ETF (RPAR) with $1.1 Bn as an Allocation fund.
- Worth noting that in the top 10: American Century has 5 funds, JP Morgan with 2, Charles Schwab with 1, iShares with 1, and Franklin Templeton with 1.
- American Century’s ETFs launched in 2019 are all in the top 10 of assets.
- For Active ETFs, the top performer over 3-years is again AVUV with 28.5% return. The next 4 in order are MOTO, OVS, AVUS, and AVDV (ranging from 21.5-16.7%).
- Lastly, who had the best final semester of their senior year? The top performer YTD was MicroSectors US Big Banks 3X Inverse Leveraged ETN (BNKD) at 43.6% with FNGS close behind at 38.4%. The next 3 in order are WEBL, SFYF, and ARKF (ranging 31.1-18.8%).
- 187 ETFs are still open that were launched in 2019, totaling $68.8 Billion, which is about 1% of the ETF industry total AUM.
- Congratulations to all the 187 ETFs graduating this year, especially the ones graduating with honors mentioned above! Our graduating class is a little smaller than last year (216), but we appreciate what they do for the ETF industry all the same.
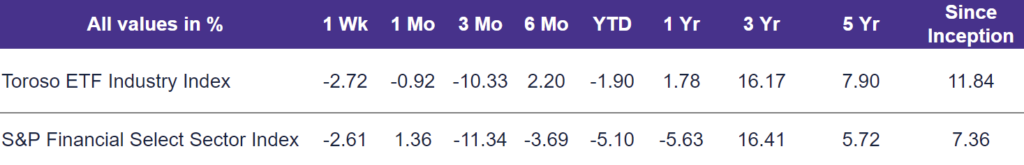
- The tracked indexes had similar experiences in the last few years. Over a 3-year period, The Toroso ETF Industry Index is up 16.17% while the S&P Financial Select Sector Index led at 16.41%.
ETF Launches
AllianzIM U.S. Large Cap Buffer20 May ETF (ticker: MAYW)
AllianzIM U.S. Large Cap Buffer10 May ETF (ticker: MAYT)
Touchstone Climate Transition ETF (ticker: HEAT)
Breakwave Tanker Shipping ETF (ticker: BWET)
Pacer US Small Cap Cash Cows Growth Leaders ETF (ticker: CAFG)
ActivePassive U.S. Equity ETF (ticker: APUE)
ActivePassive International Equity ETF (ticker: APIE)
ActivePassive Intermediate Municipal Bond ETF (ticker: APMU)
ActivePassive Core Bond ETF (ticker: APCB)
USCF Energy Commodity Strategy Absolute Return ETF (ticker: USE)
ETF Closures
Direxion Breakfast Commodities Strategy ETF (ticker: BRKY)
Direxion Daily Metals & Mining Bull 2X Shares ETF (ticker: MNM)
Direxion Daily Oil Services Bull 2X Shares ETF (ticker: ONG)
Direxion Daily S&P 500 Equal Weight Bull 2X Shares ETF (ticker: EVEN)
Direxion Daily S&P Expanded Tech Software Sector Bull 2X ETF (ticker: SWAR)
Direxion Daily TIPS Bear 2X Shares ETF (ticker: TIPD)
Direxion Daily TIPS Bull 2X Shares ETF (ticker: TIPL)
Direxion mRNA ETF (ticker: MSGR)
Defiance Daily Short Digitizing the Economy ETF (ticker: IBIT)
VanEck Digital Assets Mining ETF (ticker: DAM)
Fund/Ticker Changes
International Drawdown Managed Equity ETF (ticker: IDME) became
Aptus International Enhanced Yield ETF (ticker: IDUB)
TETF.Index Performance vs. S&P Financial Select Sector Index
(as of May 5, 2023)
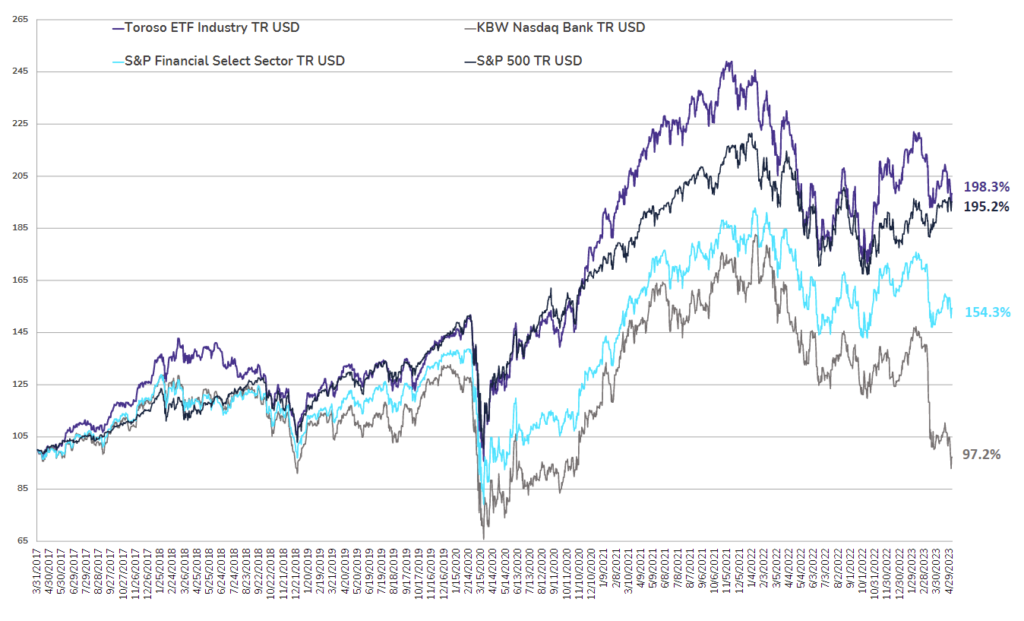
TETF.Index Performance vs. Other Leading Financial Indices
(March 31, 2017 through May 5, 2023)
Why Follow the ETF Industry KPIs
The team at Toroso Investments began tracking the ETF Industry Key Performance Indicators (KPI’s) in the early 2000’s and have been consistently reporting on, and analyzing these metrics ever since. The table above was the impetus for the creation of the TETF.Index, the index that tracks the ETF industry. Each week, we will share the statistics we believe to be the most useful for identifying industry trends, in addition to the performance of the TEFT.Index.
DISCLAIMER
Past performance is no guarantee of future returns. This article is for informational and educational purposes only; is not intended to constitute legal, tax, accounting or investment advice; and does not constitute an offer to sell or a solicitation of an offer to buy any security or service. Furthermore, the Indexes shown above are not investable. While Toroso has gathered the information presented from sources that it believes to be reliable, Toroso cannot guarantee the accuracy or completeness of the information presented and the information presented should not be relied upon as such. Any opinions expressed are Toroso’s opinions and do not reflect the opinions of any affiliates or related persons. All opinions are current only as of the date of initial publication and are subject to change without notice. All investment strategies and investments involve risk of loss, including the possible loss of all amounts invested.