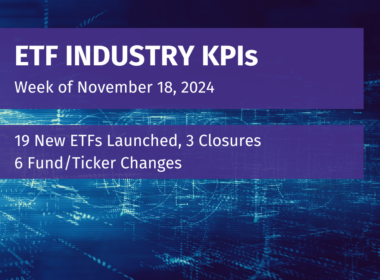
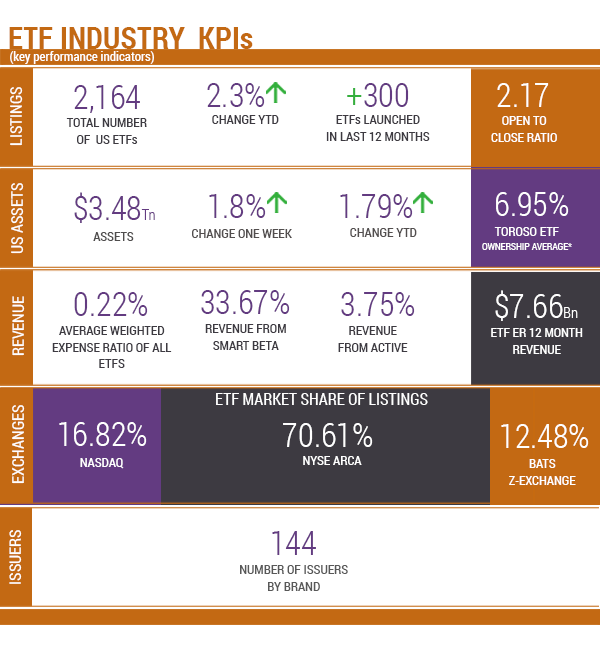
Source of KPIs: Toroso Investments Security Master, as of April 14, 2018
INDEX PERFORMANCE DATA

Returns as of April 14, 2018.
Inception Date: April 4, 2017. Index performance is for informational purposes only and does not represent the ETF. Indexes are unmanaged and one cannot invest directly in an index.Past performance is NOT indicative of future results, which can vary.
EXERCISE ISN’T THE ONLY WAY TO STAY ACTIVE
We have spent a lot of time talking about Innovation Growth Factors in the ETF industry. One factor we have yet to go in depth on is Active ETFs. With both traditional passive players Vanguard and BlackRock now entering this active ETF space, it is clearly time to dissect its growth.The three ways Toroso categorizes ETF strategies as: Traditional Beta, Smart Beta, and Active. Active is by far and away the smallest of these three by several figures, yet we believe significant growth is coming.
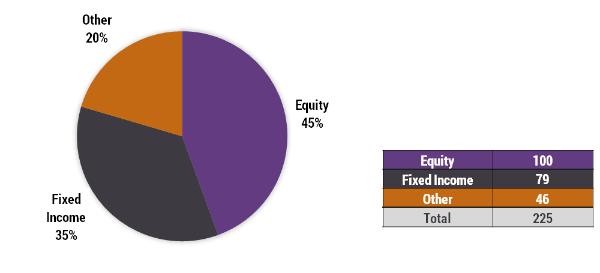
Out of the 2,164 ETFs, there are only 225 Actively managed ETFs with $52.4 Billion in AUM, only 1.5% of the ETF industry AUM. The average expense ratio is 0.54% for active ETFs and the 12-month revenue is $28.7 Billion, or approximately 3.8% of the ETF industry revenue.
Here are some statistics breaking down our insights with Active ETFs.
# OF ACTIVE US ETFs
ACTIVE US ETF AUM
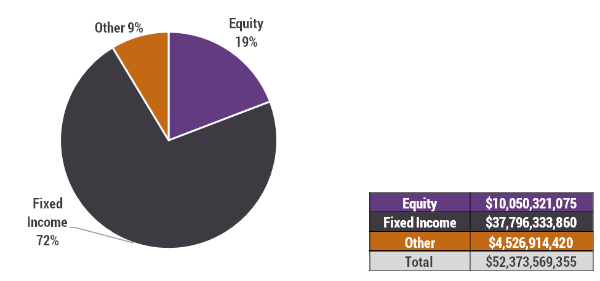
As you can see, even though Active Equity ETFs make up 45% of the Active ETFs total, they only account for 19% of the assets. At the same time, Active Fixed Income surprisingly makes up the majority of Active ETF assets with fewer funds.
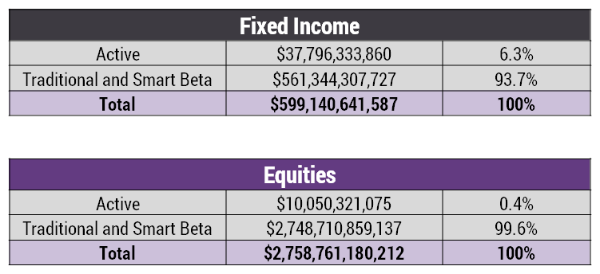
Another interesting find is that although Active Equities represent less than one half of a percent (0.4%) of total ETF Equity AUM, Active Fixed Income ETFs contrarily are 6.3% of total ETF Fixed Income AUM. Therefore, not only are there more assets in Active Fixed Income funds compared to equity, the Active Fixed Income funds carry more significance or weight on the entire Fixed Income ETF category.
WHY BE ACTIVE?
Many of the benefits of actively managed ETFs become apparent when comparing them to active mutual funds. The ETFs typically have lower fees, greater liquidity, and superior transparency. Secondly, compared to other Smart Beta or Traditional Beta ETFs, being Active is a great advantage in fields that are constantly evolving such as technology, media, and the ETF industry itself! This allows active funds to capture growth in trends and different market environments in the short term, and not have to wait for a rebalance triggered by the calendar.
The significant fee compression and dominance by a few players in the passive ETF space is causing asset managers to look for new and innovative strategies to bring to the ETF market. Traditional passive ETFs average annual expense ratio is 0.34%. Currently, Active ETFs are at 0.54%. This margin may come down as new competition enters, but we believe it will never eclipse the low cost of purely passive strategies. Of course, for an Active ETF to be successful and raise AUM, it will need to provide better performance when compared to passive strategies.
As the simplicity of the ETF investment structure gains acceptance and appears to outpace the growth of mutual or hedge funds, we see the historical avoidance of transparent active ETFs seems to be dissipating. When established players like BlackRock and new innovators like Amplify pursue this niche corner of the ETF space called active ETFs, its importance and influence can no longer be overlooked. They will not overtake traditional or smart beta ETFs any time soon in terms of numbers or AUM, but we expect them grow meaningful assets and revenue in the coming years. With Active strategies clearly carving a sizable chunk of Fixed Income, can active Equity be far behind? We don’t think so.
ETF LAUNCHES
| iShares MSCI USA Sml-Cp ESG Optmzd ETFESMLVanEck Vectors Real Asset Allocation ETFRAAXPacer Military Times Best Employers ETFVETSPGIM Ultra Short Bond ETFPULS |
ETF LAUNCH OF THE WEEK
VanEck Vectors Real Asset Allocation ETF (RAAX)
Here’s another example of a major issuer entering the active ETF space.
TETF INDEX PERFORMANCE VS LEADING FINANCIAL INDEXES
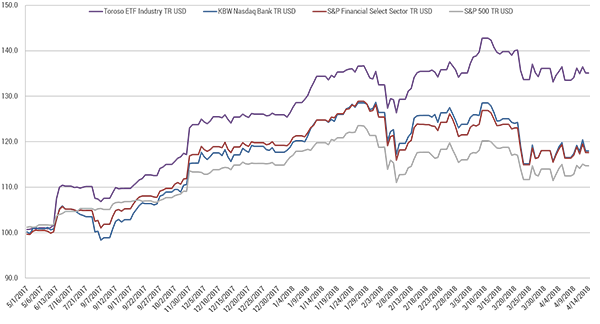
As of April 14, 2018.
TOP 10 HOLDINGS PERFORMANCE

BOTTOM 10 HOLDINGS PERFORMANCE

As of April 14, 2018. Source: Morningstar Direct.


