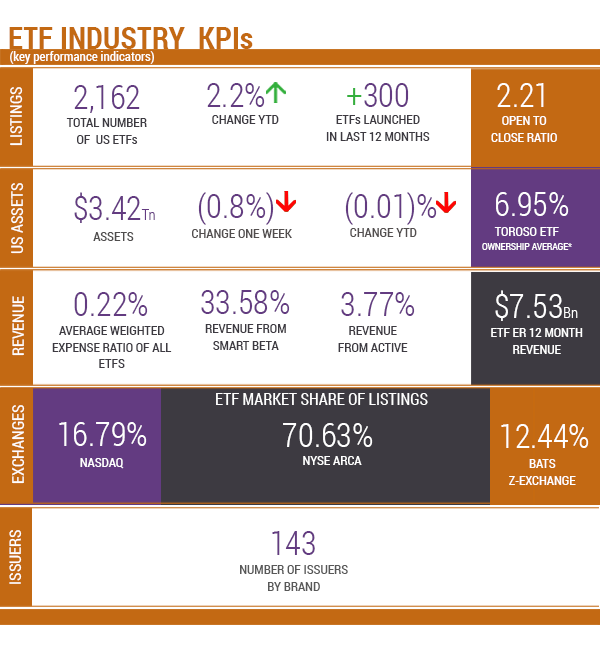
Source of KPIs: Toroso Investments Security Master, as of April 9, 2018
INDEX PERFORMANCE DATA
| 04/9/2018 | 1 Wk | 1 Mo | 3 Mo | 6 Mo | 1 Yr | QTD | YTD | Since Inception |
|---|---|---|---|---|---|---|---|---|
| Toroso ETF Industry Index | (1.95%) | (3.70%) | 3.83% | 13.92% | 34.65 | (1.95%) | 5.98% | 32.76% |
| S&P Financial Select Sector Index | (1.38%) | (5.87%) | (4.04%) | 4.04% | 17.06% | (1.38%) | (2.32%) | 16.07% |
Returns as of April 9, 2018.
Inception Date: April 4, 2017. Index performance is for informational purposes only and does not represent the ETF. Indexes are unmanaged and one cannot invest directly in an index.Past performance is NOT indicative of future results, which can vary.
THE CORRELATION BETWEEN AN INDUSTRY AND AN INDEX
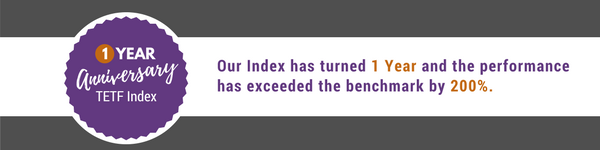
This week instead of celebrating a holiday, we are celebrating an anniversary. On April 1st, 2018, TETF.index turned one year old while returning over 36%. So, the natural question we want to ask is this – How close does the TETF.index track the growth of the ETF industry and what can we learn?
Much is written about the Industry’s growth from a variety of sources and studies. But since the Index is only 1 year old, our sample data set is small and now is the time to start tracking the thesis. The chart below superimposes the returns of the Index over the percentage change in the US ETF assets. The correlation is apparent.
1 YEAR CUMULATIVE GROWTH
TETFINDEX VS US ETF ASSETS
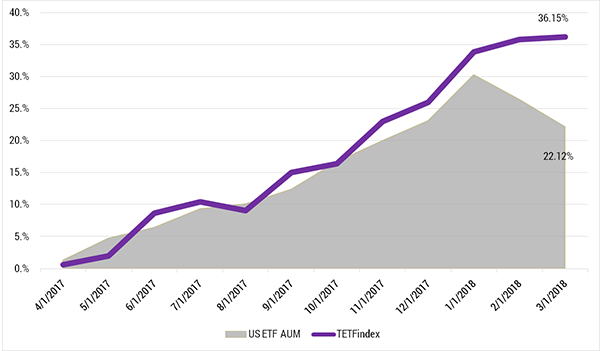
In the past 12 months, US ETF assets have grown by $620 billion or 22%. It appears the public equity markets are anticipating more growth since the constituents of TETF.index have outperformed the rise in assets. Below, we look at the 1-year growth of some the top public issuers:
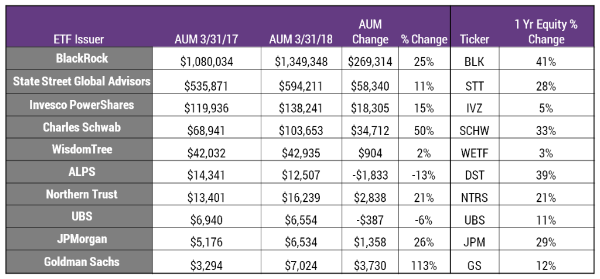
As you can see, there is consistent growth across most of the companies. Both Charles Schwab and Goldman Sachs showed an extraordinary increase in assets, which is surprising considering they sponsor less than 30 ETFs combined. Another interesting data point is the correlation of Wisdom Tree’s performance to its assets.
We also looked at the top flows by ETF category over the past year. The data supports the thesis that most ETF growth comes from the client alignment factor of low fees. IEFA is the largest winner with an expense ratio of 0.08% with is substantially lower than iShares’ similar fund EFA with an expense ratio of 0.32%.
TOP 1 YEAR FLOWSTOP
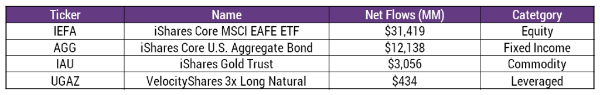
Source: Bloomberg data
Additionally, we looked at the top 1-year performance by category, which shows the power of ETF innovation growth factors. From this information, we can see that there is room for new ideas and that such new ideas can be winners. It will be interesting to see where next year’s winners come from.
1 YEAR PERFORMANCES
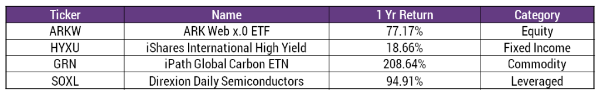
Source: Bloomberg data
It has been a great year for ETF growth and we expect this trend to continue. Whether it is the alignment of low fees, transparency, or innovation that drives the growth of the industry, Industry growth is real. Watch TETF.index to see if it is really a proxy indicator of that growth.
ETF LAUNCHES
| Xtrackers Russell 1000 US QARP ETF | QARP |
| iShares Bloomberg Roll Sel Brd Cmdty ETF | CMDY |
| iShares US Infrastructure ETF | IFRA |
| LHA Market State Tactical US Equity ETF | MSUS |
TETF INDEX PERFORMANCE VS LEADING FINANCIAL INDEXES
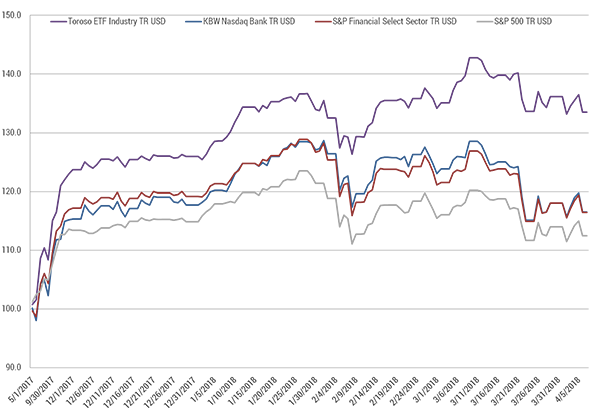
As of April 9, 2018.
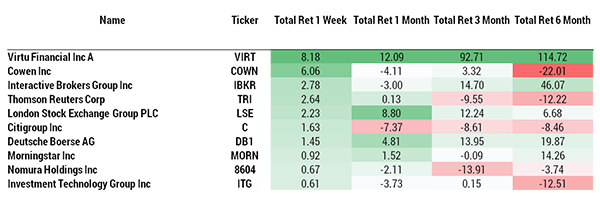
TOP 10 HOLDINGS PERFORMANCE
BOTTOM 10 HOLDINGS PERFORMANCE
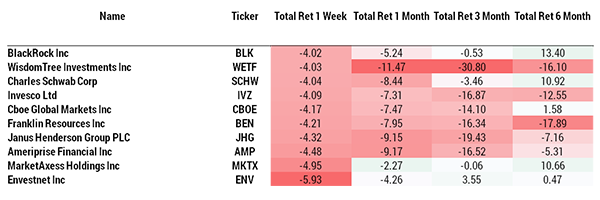
As of April 9, 2018. Source: Morningstar Direct.