Welcome to the ETF Think Tank Weekly Research, a communication written by our team of ETF Nerds on a mission to educate investors and empower financial advisors. Read on for our perspective on the benefits of ETFs, highlights in the industry, and noteworthy innovations.
In the last research note, we considered looked into transparency as it relates to the structure of mutual funds and ETFs.
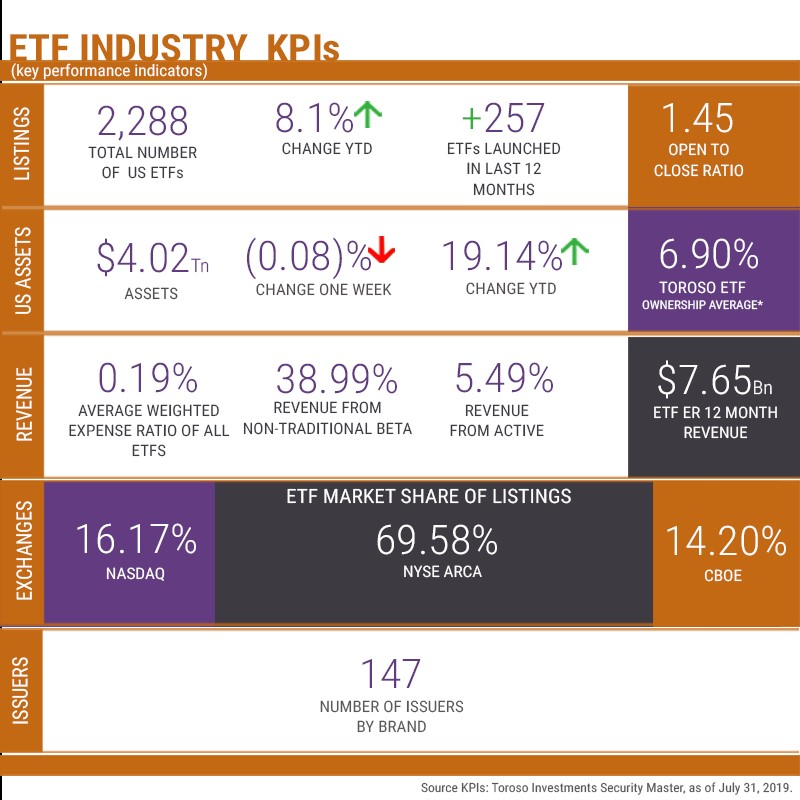
This week, we share our research on the growth of the ETF industry including our usual key performance indicators (KPIs) on number of ETFs listed, assets, revenue, exchange market share and number of issuers. In this halftime report, we cover the state of the ETF industry in 2019 by reviewing how these KPIs have changed through July 9, 2019.
The ETF Think Tank is a community of advisors focused on a client centric approach to investing through the use of ETFs. Each week we disseminate research on the growth of the ETF industry including key performance indicators (KPIs) on number of ETFs listed, assets, revenue, exchange market share and number of issuers. This data is useful in serving to monitor the trends in the ETF ecosystem which we believe will have value to financial professionals who embrace the evolution and growth that is taking place as a result of ETF asset growth.
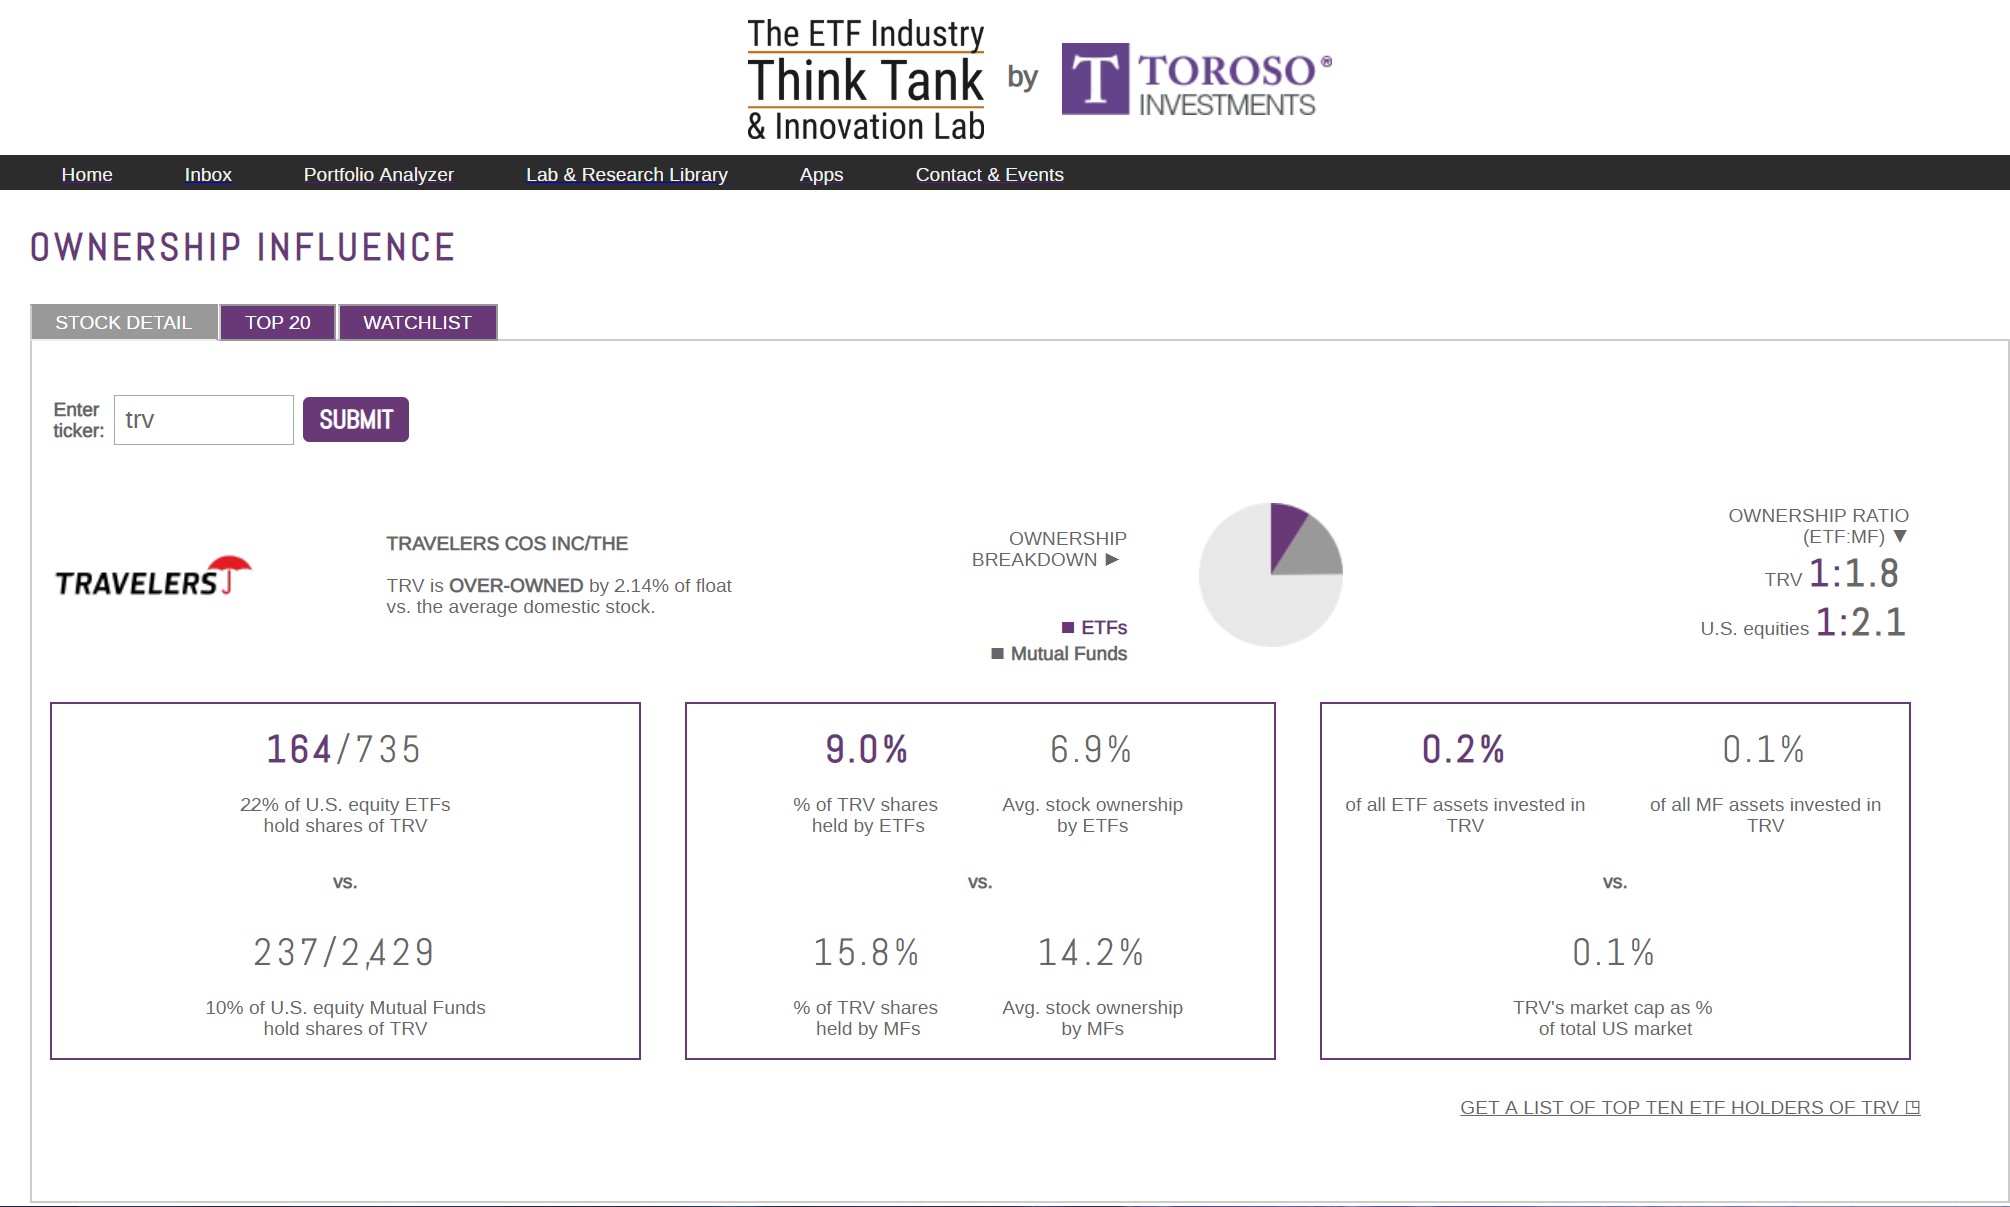
In this edition produced for ETF.com, we follow our August 13th, 2019 half time report with a deeper dive into some of the statistic; the Ownership Influencer and Smart Cost Calculator.
 For a larger view, please click on the image above.
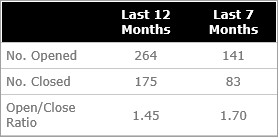
New Listings Grow Faster Than Closings
There are currently 2,288 ETFs listed in the U.S. Over the last 12 months, we have seen 257 new ETFs launch compared with 177 ETFs that closed, for a 1.45 open-to-close ratio.
However, the ratio is showing improvement. We have witnessed the ratio improving to 1.70 for the first seven months of 2019, or 1.70 new ETFs for each closed ETF. This KPI shows an increasing appetite for issuers to continue to launch new and creative ETF ideas.
Assets Grow While Influence Diversifies
As of August 1, 2019, U.S. ETF assets reached $4.028 trillion, a sequential record high and growth at 19.14%. Another KPI of significance is the “ownership influence score.”
Our average ETF ownership influence has dropped this year, from 8.25% at the beginning of 2019 to 6.90%, due to a more diversified offering and a concentration of ETF flows toward large cap U.S. equities. The ownership influence score is the average amount of the market cap of every U.S. stock owned by ETFs.
We often speak about intended and unintended consequences of ETF growth. In this report we decided to focus on Ownership Influence of the stocks in the Dow Jones which range as low as 3.5% for Walmart (WMT) and as high as 9% for Travelers (TRV). In our judgement, we argue that ETF Ownership Influence at 6.9% on average broadly speaking is not an impactful percentage of most stocks, but it is worth noting that this percentage on average is down from 8.25% at the beginning of the year.
Walmart is a unique situation because the Walton family continues to own 49.6% of the Company. Noteworthy is the fact that Walmart’s return has outperformed the SPY over these past 5 years at 11.25% vs 11.21%, respectively. Similar outperformance has been earned the past 26 years period with a compound return of 10.34% vs 9.57%, respectively.[1] Of course, we all know what has happened with Amazon which is now owned 5% by ETFs. Nevertheless, WMT as a broad holding within ETFs has been a positive allocation; let’s not forget that this company now embraced by value indexers is now worth $312 Billion and growing by about 2-3 percent. Now that’s “Ownership Influence”. In contrast, Travelers is 9% owned by ETFs and also a very successful company, but with only $38 Billion in market value the large cap trading flows may have a greater influence. According to Blomberg, the average trading volume for Travelers in July was only 838 thousand shares down from a range of 1.3 million to 2.01 million shares traded over this past year. In this context, we see the 9% or about 23.4 million shares as meaningful and something to watch.
For a larger view, please click on the image above.
[Use ETF.com’s stock finder tool to find an ETF’s allocation to a certain stock.]
Revenue Grows While Fees Continue To Decline
The average weighted expense ratio for U.S. ETF remains the same at 0.19% from June 30th. Fee compression may be a slow continuum, but with increased assets, the projected 12-month revenue increased from $6.83 billion in January to $7.65 billion today.
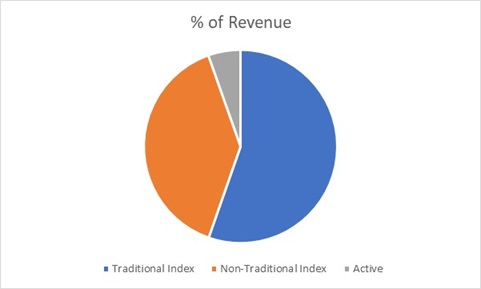
The revenue also continues to diversify away from low cost, traditional beta and toward nontraditional passive “smart beta” ETFs and active ETFs.
The percentage of ETF revenue from nontraditional passive ETFs in January was 36.38%; today it’s 38.99%. Active ETF revenue also gained market share, growing from 5.11% to 5.48%. These KPIs help show that investors are still looking for interesting and creative strategies to help diversify their portfolio.
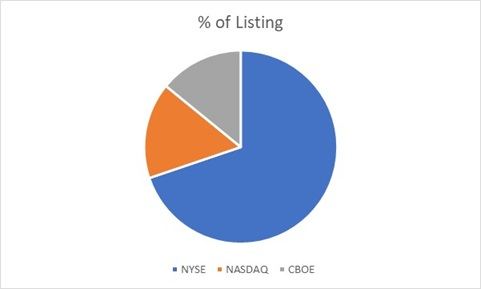
Exchange Market Share Remains Constant
Exchange market share of ETF listings has remained constant in 2019, with NYSE in a dominant position. Cboe Global Markets took share away from Nasdaq, increasing from 13.26% of listings to 14.20%, while Nasdaq decreased from 16.68% to 16.17%.
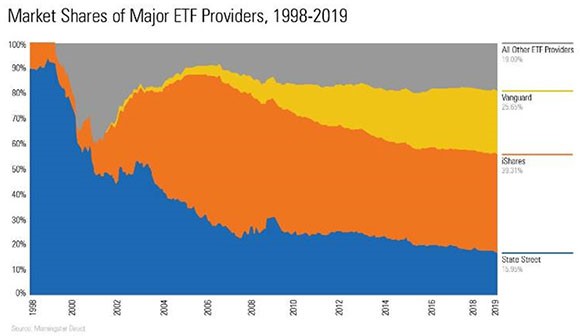
Growth In Issuers Continues
The number of branded issuers continues growing this year with 3 more since last month. Since the beginning of the year, new asset managers have increased from 133 to 147. That’s an 11% increase, and we think an acceleration of more new asset managers who are embracing the superior structure of the ETF wrapper.
That said, the chart below from Morningstar Research shows assets remain concentrated with the top three issuers. It appears that the term “Smart Beta” is mostly used by financial professionals who broadly are seeking to lower their investment costs. Vanguard’s market expansion is coming at the expense of State Street and iShares. We expect that innovations may draw flows in the billions, but broad low-cost access will remain in the hands of the few who have large scale leadership.
For a larger view, please click on the image above.
Contact Dan Weiskopf at dweiskopf@torosoinv.com
 |
 |
[1] Bloomberg, performance chart from July 31, 1993 through July 31, 2019