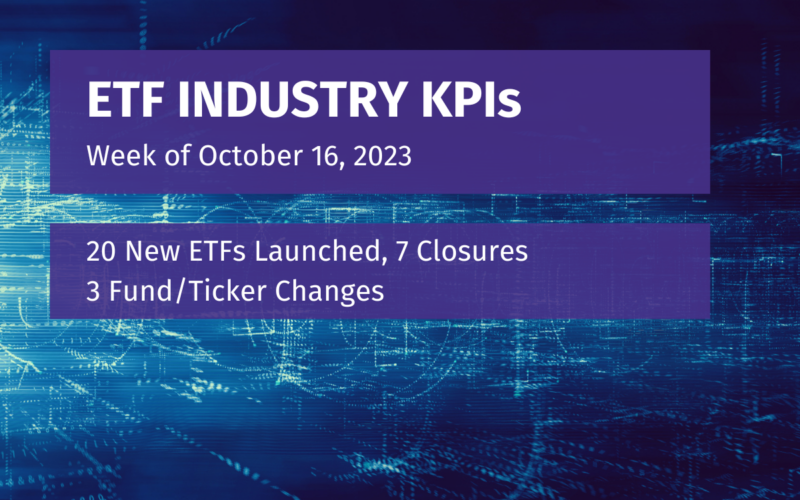
Week of October 16, 2023 KPI Summary
 Ryan Fitzgerald
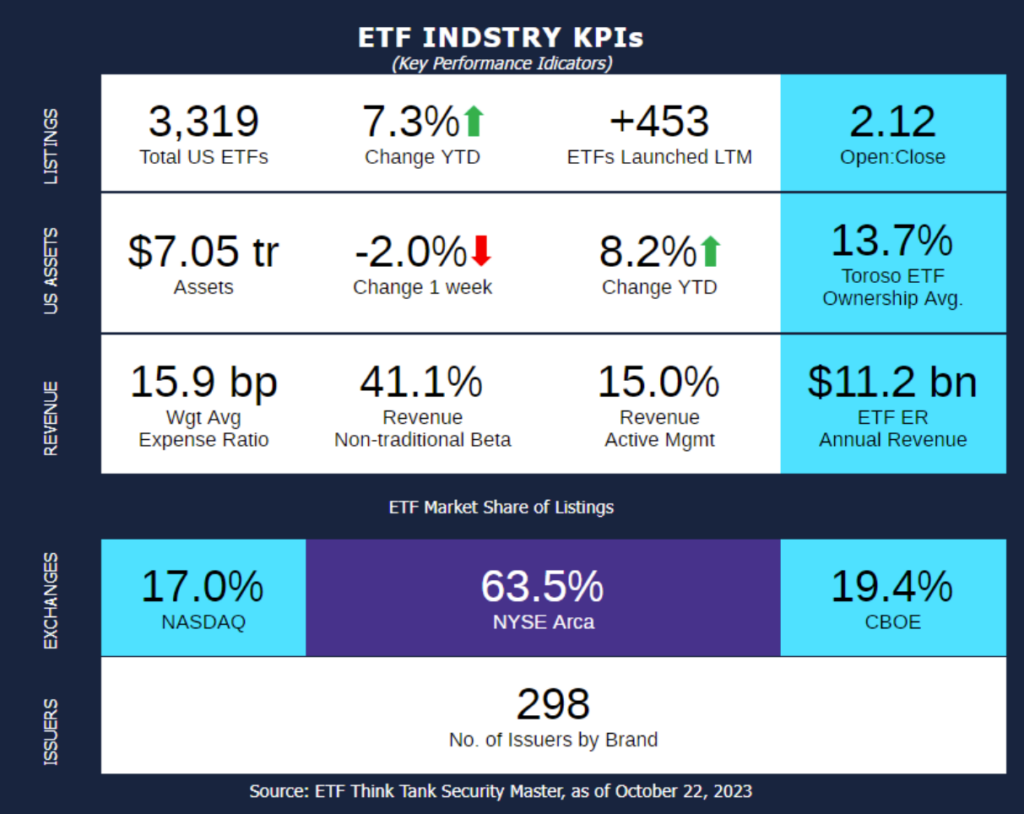
- This week, the industry experienced 20 ETF launches and 7 closures, shifting the 1-year Open-to-Close ratio to 2.12 and total US ETFs to 3,319.
- October 23rd is my mother’s birthday so a big Happy Birthday to Eileen! In light of my mom’s birthday, let’s talk about what else can come to mind for “MOM” in the ETF industry: Momentum ETFs.
- There are 41 Momentum ETFs according to the ETF Think Tank Security Master, totaling $18.1 Billion.
- Like many ETF categories and sectors, the Momentum ETFs are top-heavy in assets. The top 5 ETFs constitute $14.1 Billion. These 5 are (in order of most to least) MTUM, FV, IMTM, XMMO, and PDP.
- The largest by far ($7.7 Billon) is iShares MSCI USA Momentum Factor ETF (MTUM), which was launched back in 2013.
- IMTM has the best 1-year total returns (14.7%) of the top 5 listed and is 5th overall of the 41 total. The top ETF in 1-year total returns is Invesco’s IDMO (Invesco S&P International Developed Momentum ETF) at 19.3%.
- Of the 32 Momentum ETFs that have a 5-year track record, Invesco’s PTF (Invesco Dorsey Wright Technology Momentum ETF) has the best total returns with 17.6%, with the next highest fund at 11.4%.
- Like many ETF categories and sectors, the Momentum ETFs are top-heavy in assets. The top 5 ETFs constitute $14.1 Billion. These 5 are (in order of most to least) MTUM, FV, IMTM, XMMO, and PDP.
- There are 17 Issuers represented in the 41 Momentum ETFs.
- First Trust leads with 18 ETFs and Alpha Architect is in a distant second with 4 Momentum ETFs.
- First Trust’s 18 ETFs amount to $4.3 Billion in assets, which places them contrarily in a distant second behind iShares with $9.1 Billion across their 2 Momentum ETFs.
- Momentum ETFs have an average Expense Ratio of 54.8 bps, just above the ETF industry average of 53.6 bps.
- If Alpha Architect’s VMOT is removed with its high ER over 2%, the average drops to 50.8 bps.
- There are 41 Momentum ETFs according to the ETF Think Tank Security Master, totaling $18.1 Billion.
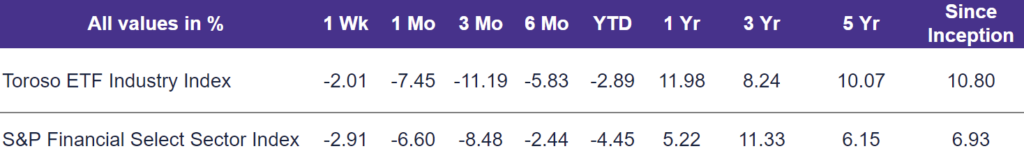
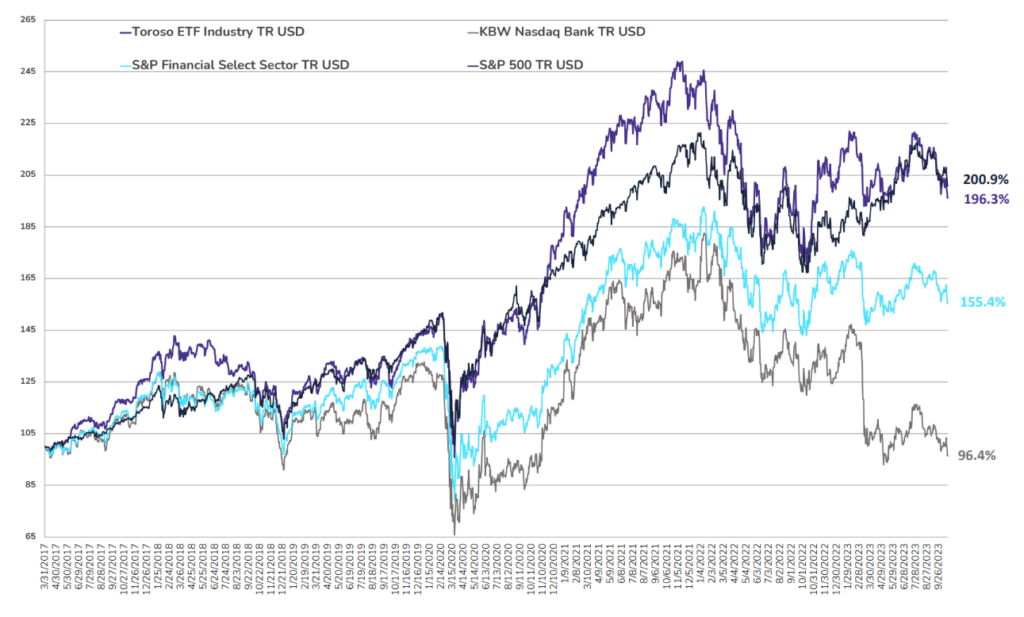
- The tracked indexes experienced similar performance last week. The Toroso ETF Industry Index was down -2.01% while the S&P Financial Select Sector Index trailed at -2.91%.
ETF Launches
CoreValues Alpha Greater China Growth ETF (ticker: CGRO)
Eaton Vance High Yield ETF (ticker: EVHY)
Eaton Vance Intermediate Municipal Income ETF (ticker: EVIM)
Eaton Vance Ultra-Short Income ETF (ticker: EVSB)
iShares LifePath Retirement ETF (ticker: IRTR)
iShares LifePath Target Date 2025 ETF (ticker: ITDA)
iShares LifePath Target Date 2030 ETF (ticker: ITDB)
iShares LifePath Target Date 2035 ETF (ticker: ITDC)
iShares LifePath Target Date 2040 ETF (ticker: ITDD)
iShares LifePath Target Date 2045 ETF (ticker: ITDE)
iShares LifePath Target Date 2050 ETF (ticker: ITDF)
iShares LifePath Target Date 2055 ETF (ticker: ITDG)
iShares LifePath Target Date 2060 ETF (ticker: ITDH)
iShares LifePath Target Date 2065 ETF (ticker: ITDI)
Hartford Quality Value ETF (ticker: QUVU)
T-Rex 2X Inverse NVIDIA Daily Target ETF (ticker: NVDQ)
T-Rex 2X Long NVIDIA Daily Target ETF (ticker: NVDX)
T-Rex 2X Long Tesla Daily Target ETF (ticker: TSLT)
T-Rex 2X Inverse Tesla Daily Target ETF (ticker: TSLZ)
Parametric Hedged Equity ETF (ticker: PHEQ)
ETF Closures
FormulaFolios Hedged Growth ETF (ticker: FFHG)
FormulaFolios Smart Growth ETF (ticker: FFSG)
FormulaFolios Tactical Growth ETF (ticker: FFTG)
FormulaFolios Tactical Income ETF (ticker: FFTI)
ASYMshares™ ASYMmetric S&P® 500 ETF (ticker: ASPY)
ASYMmetric Smart Alpha S&P 500 ETF (ticker: ZSPY)
ASYMmetric Smart Income ETF (ticker: MORE)
Fund/Ticker Changes
Hartford Quality Value Fund Class A and Class I (tickers: HVOAX, HVOIX)
became Hartford Quality Value ETF (ticker: QUVU)
Neuberger Berman Greater China Equity Fund (tickers: NCEAX, NCECX, NCEIX)
became Neuberger Berman China Equity ETF (ticker: NBCE)
Neuberger Berman Global Real Estate Fund (tickers: NGRAX, NRECX, NGRIX)
became Neuberger Berman Global Real Estate ETF (ticker: NBGR)
TETF.Index Performance vs. S&P Financial Select Sector Index
(as of October 20, 2023)
TETF.Index Performance vs. Other Leading Financial Indices
(March 31, 2017 through October 20, 2023)
Why Follow the ETF Industry KPIs
The team at Toroso Investments began tracking the ETF Industry Key Performance Indicators (KPI’s) in the early 2000’s and have been consistently reporting on, and analyzing these metrics ever since. The table above was the impetus for the creation of the TETF.Index, the index that tracks the ETF industry. Each week, we will share the statistics we believe to be the most useful for identifying industry trends, in addition to the performance of the TEFT.Index.
DISCLAIMER
Past performance is no guarantee of future returns. This article is for informational and educational purposes only; is not intended to constitute legal, tax, accounting or investment advice; and does not constitute an offer to sell or a solicitation of an offer to buy any security or service. Furthermore, the Indexes shown above are not investable. While Toroso has gathered the information presented from sources that it believes to be reliable, Toroso cannot guarantee the accuracy or completeness of the information presented and the information presented should not be relied upon as such. Any opinions expressed are Toroso’s opinions and do not reflect the opinions of any affiliates or related persons. All opinions are current only as of the date of initial publication and are subject to change without notice. All investment strategies and investments involve risk of loss, including the possible loss of all amounts invested.