
Broad Market
Mutual fund to ETF conversions are clearly gaining steam in 2023, and this is led by active funds. Assets held in ETFs that have been converted from mutual funds now total $78 billion, which is almost double the year-end tally in 2022. Around 75% of the 376 new ETFs launched since October 2023 have been active. [i] This trend is something we at Tidal and the ETF Think Tank have been writing about for years. The number of active ETFs now represents 1,104 of the 3,301 ETFs and 15% of the revenue. Those keeping up with our weekly KPI reports will note that Active only represents 6% of the aggregate AUM. We expect this dollar value to increase and note that actively managed funds on a weighted basis charge about 2.5 times the average weighted expense ratio of passive (42.2 Bps vs 16.7 Bps). Where inefficiencies and opportunity exist, fee matters less. ETFs are simply the modern wrapper that investors prefer because of lower taxes, transparency, and reduced costs. The canvas for small caps is mostly open if an asset manager can deliver clear alpha form an established mutual fund.
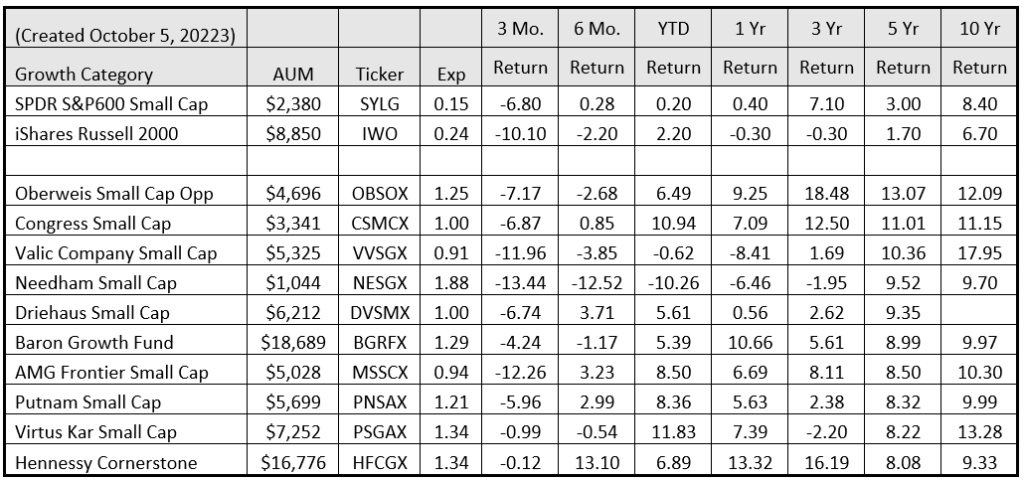
Investors in small caps, an area we recently wrote about in these pages, may still have some mutual funds worth highlighting. Bottomline, there is no way around it – it takes 10 years to build a 10-year track record. To this point, we recently used a new Bloomberg filter to screen through the universe of mutual funds, which comprised $647 billion. This of course follows our recent Think Tank Exchange podcast with Mathew Bartolini and our small cap piece, Structure Matters: Small- Cap Zingers. Bottomline, we see the SPDR 600 Small Cap ETFs (SPSM or SPYG) and the iShares Russell 2000 Growth ETF (IWO) as core benchmarks to measure and compete for alpha and came across 20 mutual funds which look interesting on a long term basis. Moreover, we continue to believe that any small cap fund should be measured against an ETF rather than an index. Why not use a 3 Bps ETF (SPSM) at that is, in fact, investible rather than an index which, in fact, may provide a tracking error.
To this point, we would like to highlight the Actively Managed Mutual Funds below. Rarely have we ever highlighted mutual funds in this research, but as mutual fund managers look to grow through the ETF wrapper, we want to be open minded. In fact, since we have fielded some questions around capacity constraints within the ETF wrapper for small caps, we think this short list demonstrates that a range of $4 billion to $17 billion can be managed without capacity constraints (Upon request we are happy to provide the complete list).
Drilling Deep Into Actively Managed Fixed Income
The ETF Think Think Tank screening tools are useful in screening broad KPIs for fun, but few appreciate the power the tools provide in narrowing down fixed income objectives. Sure, we can start with the broad choices as benchmarks to beat (BND vs AGG).

However, we can also screen through some fun KPIs. For example, here are 4 that may surprise you:
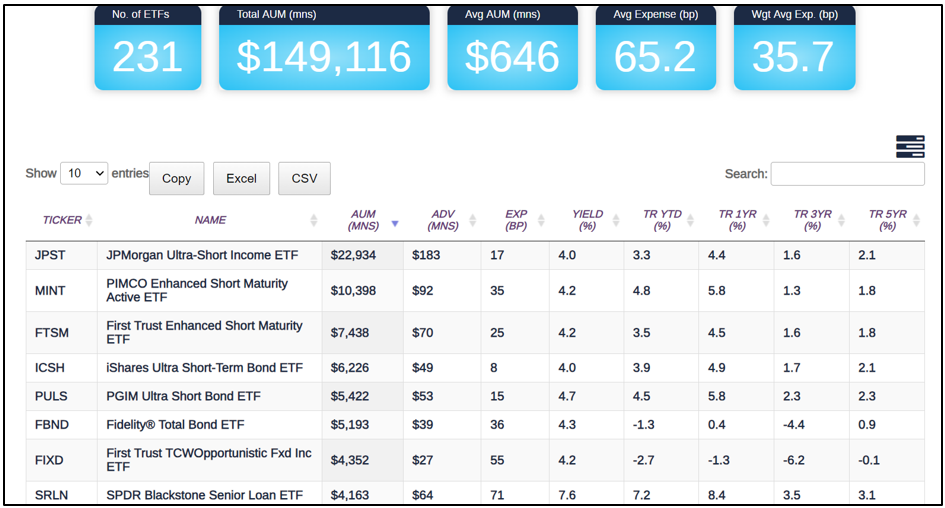
- Fees range from BKAG which is free up to 1.13%, but average out at 37.9 Bps, or weighted avgerage by AUM at 12.7 Bps. Obviously, the fee range has much to do with Bond Type (20 Tank choices) and credit quality (5 Tank choices) which are two separate screening tools that the Tank provides.
- Concerned about inflation? Check out the choices among TIPs
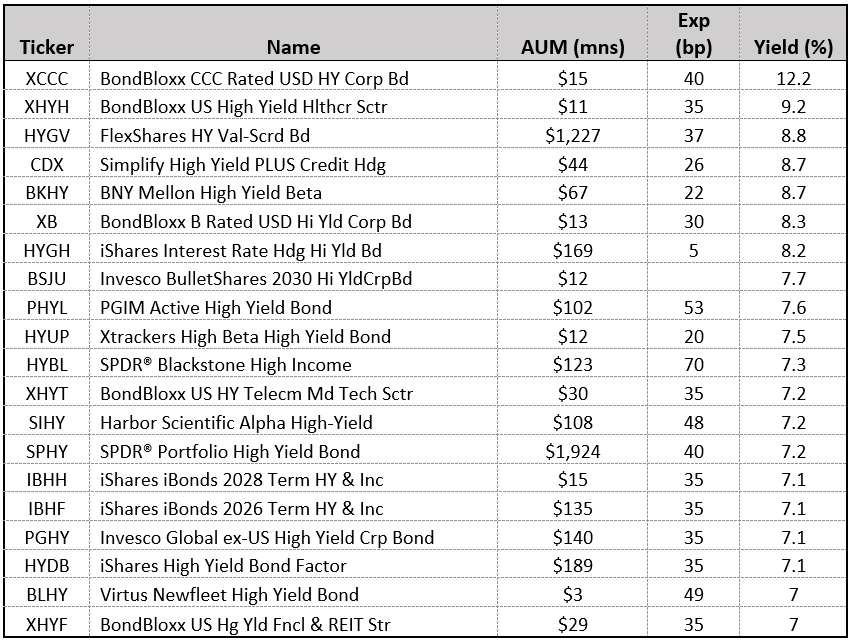
- No concerns about a deep recession? Check out the 74 ETF choices – yield currently ranges from 4% to 12.2%, iShares iBond 2023 (IBHC) vs. BondBlox (XCCC)
- Fixed Income will eclipse ETFs with 550 choices or just about 16.7% of the aggregate 3,301 ETFs available very soon, but represent about 19% of the aggregate AUM.
- A known flaw in fixed income ETFs has been that more debtor issuance has tended to draw more ETF ownership despite the inverted nature that more debt in the markets should not lead to better credit quality. For this reason, it should please readers that the number of Active fixed income ETFs now represent 42% of the ETF choice (231/549).
- Most investors would agree that active management has a clear alpha opportunity over the passive benchmarks or passive ETFs, which is the reason why we would expect significant growth in AUM in this ETF category. At $149 billion or 11% of the $1,350 trillion overal AUM in the category, we would expect significant growth inflows, especially as the 60/40 model is under so much pressure.
Hidden Gems: Targeting Cash Flows
For about 35 years, investors have enjoyed a bull market in bonds. At the start of 1982, the interest rate on 10-year U.S. Treasury bonds was 14.2%. Historically, the 30-year treasury yield reached upwards of 15.21% in 1981. These numbers are helpful for context since most people seem to only recall a rate of 2% to 3%. Moreover, in such a long-term trend, most bond investors looked smart, and mistakes were forgiven so long as defaults were avoided.
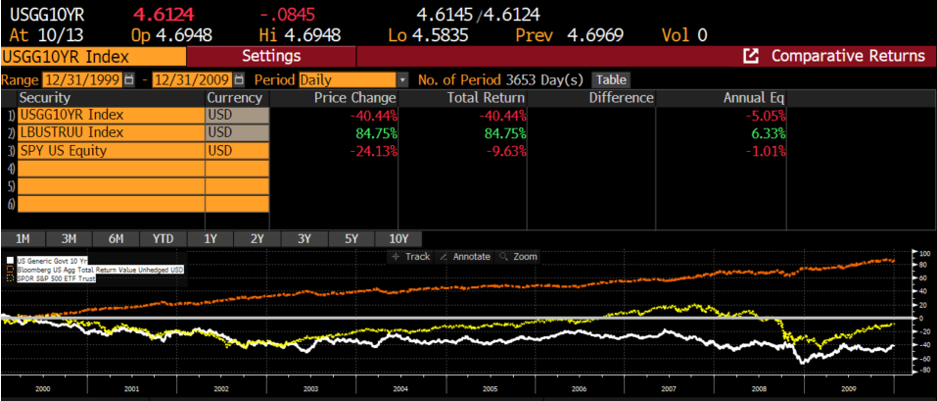
Managing or navigating the yield curve may have generated alpha and obviously an improved credit situation on a bond, but the power of the Federal Reserve and America’s general monetary policy led to a powerful 60-40 model ETF. This was especially the case during the “lost decade” – between 1999 and 2009. Remember the Lehman Bond index, which today is the Bloomberg Barclays U.S. Aggregate Bond Index?[ii]

There are many folks on X (formerly Twitter) forecasting a credit spread crisis, and we would agree the thought is very rational. ETFs are an effective tool in every crisis to measure liquidity and find price discovery. Remember when the Fed came in through Blackrock and bought shares during Covid? We bring this up because we believe that anyone anticipating such an event should also be looking at what they might do as users of ETFs to capture the opportunity. In today’s market, an investor could choose between:
- Credits that are CCC or BBB-
- Duration 2 years, 5 years or 10-year+
- Sectors such as healthcare, energy, finance, or telco
- Taxable or High Yield Municipals
Real Life Tank Battle Ground Stories
Many of us on the investment team attended an insightful SSgA event last week where the focus was on fixed income. In certain ways, it seems kind of crazy to think that the SPDR Bloomberg 1-3 Month T-Bill ETF has a 30-day SEC Yield of 5.25%, but maybe that view is only a surprise coming from the context of the past 2 years. Those of us who remember the 80s may be thinking that capturing this 5% yield makes sense in anticipation of a fall off in price and a yield spike that soon bounces to double digits, at least in the credit markets. Either way, congrats to SSgA for drawing inflows into BIL of $4.270 billion in this recent month and nearly $7.7 billion YTD. [iii]
Summary
Because of the recent past, many financial advisors have given up on active strategies and quite possibly even being active in their decisions. We think this is a mistake since whether small cap equities, fixed income or even a constant review of conditions as they appear today versus the past 3-5 years, security selection needs to be emphasized to meet financial goals. Simply owning the S&P 500 and or a basket of risk-based funds is not what people need to pay a premium for. Sure, financial planning is critical, but as markets today are embroiled in new risks part of the job of financial advisors is to optimize or maximize a range of investment potential outcomes. Afterall, no financial advisor can look across the table at a client and promise that they have planned for a lost decade of returns right before they tell such client they are good for retirement. Don’t be complacent!
[ii]https://www.investopedia.com/terms/l/lehmanaggregatebondindex.asp
[iii] Bloomberg ETF Flows Screen (EFLO)
Disclosure
All investments involve risk, including possible loss of principal.
The material provided here is for informational purposes only and should not be considered an individualized recommendation or personalized investment advice. The investment strategies mentioned here may not be suitable for everyone. Each investor needs to review an investment strategy for his or her own particular situation before making any investment decision.
All expressions of opinion are subject to change without notice in reaction to shifting market conditions. Data contained herein from third party providers is obtained from what are considered reliable sources. However, its accuracy, completeness or reliability cannot be guaranteed.
Examples provided are for illustrative purposes only and not intended to be reflective of results you can expect to achieve.
The value of investments and the income from them can go down as well as up and investors may not get back the amounts originally invested, and can be affected by changes in interest rates, in exchange rates, general market conditions, political, social and economic developments and other variable factors. Investment involves risks including but not limited to, possible delays in payments and loss of income or capital. Neither Toroso nor any of its affiliates guarantees any rate of return or the return of capital invested. This commentary material is available for informational purposes only and nothing herein constitutes an offer to sell or a solicitation of an offer to buy any security and nothing herein should be construed as such. All investment strategies and investments involve risk of loss, including the possible loss of all amounts invested, and nothing herein should be construed as a guarantee of any specific outcome or profit. While we have gathered the information presented herein from sources that we believe to be reliable, we cannot guarantee the accuracy or completeness of the information presented and the information presented should not be relied upon as such. Any opinions expressed herein are our opinions and are current only as of the date of distribution, and are subject to change without notice. We disclaim any obligation to provide revised opinions in the event of changed circumstances.
The information in this material is confidential and proprietary and may not be used other than by the intended user. Neither Toroso or its affiliates or any of their officers or employees of Toroso accepts any liability whatsoever for any loss arising from any use of this material or its contents. This material may not be reproduced, distributed or published without prior written permission from Toroso. Distribution of this material may be restricted in certain jurisdictions. Any persons coming into possession of this material should seek advice for details of and observe such restrictions (if any).