Week of June 12, 2023 KPI Summary
 Ryan Fitzgerald
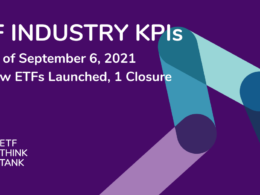
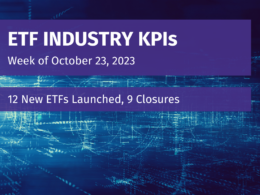
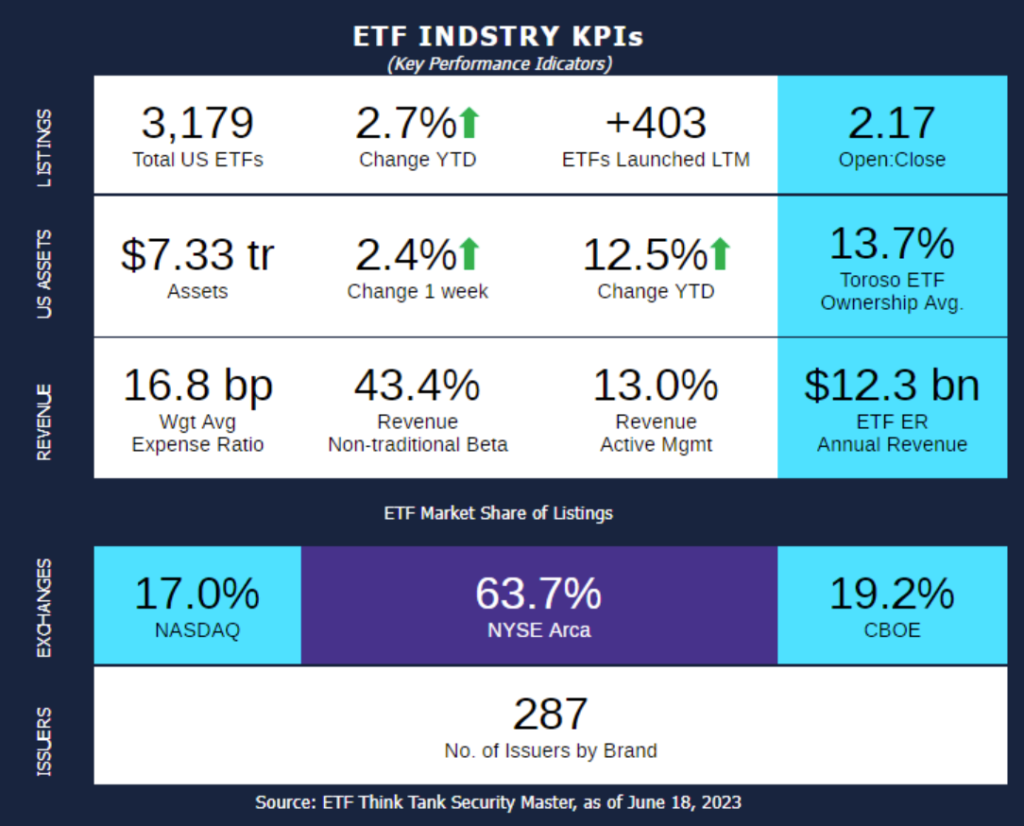
- This week, the industry experienced 14 ETF launches and 1 closure, shifting the 1-year Open-to-Close ratio to 2.17 and total US ETFs to 3,179.
- The current $7.33 Trillion in Total US ETF assets is the highest recorded ever in our weekly KPIs. This passed the previous peak on 12/31/2021 of $7.22 Trillion.
- Happy Summer everyone! Tomorrow, Wednesday June 21, is the first day of summer. While Winter 2023 was mild with assets, let’s see how Spring fared (data comparing 3/19/2023 to 6/19/23):
- 10.0% increase in total assets (approximately $666 Bn), and a 1.8% increase in total US ETFs (+56).
- From our 11 asset class categories, Geared/Swaps increased the most (22.9%) with Options close behind (21.8%). Currency had the largest drop by far (-27.2%). The two largest asset classes of Equity (76.7% of assets) and Fixed Income (18.6%) both elevated 11.8% and 3.8% respectively.
- Major change in 12-month ETF Expense Ratio revenue up from $11.1 Bn to $12.3 Bn.
- Active ETF revenue is slightly down from 13.2% to 13.0%.
- +10 additional ETF issuers, which is the most since the Winter of 2022 (+23).
- Spring 2023 has been the largest jump in assets in one of the 4 seasons in the past 2.5+ years, which is as long as we have been tracking it in the KPIs. The next closest is Winter 2021 at +9% in assets. This gives insight into the likely positive 2nd Quarter report for the industry.
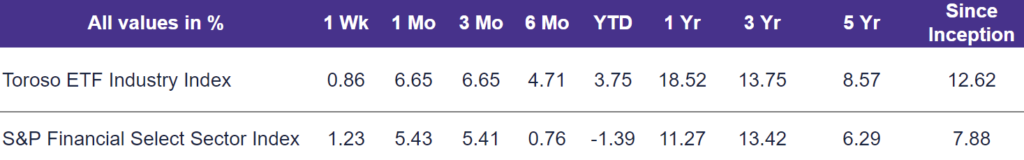
- The tracked indexes had similar experiences over the Spring. Toroso ETF Industry Index was up 6.65% while the S&P Financial Select Sector Index trailed at 5.41%.
ETF Launches
Aptus Large Cap Enhanced Yield ETF (ticker: DUBS)
Simplify Market Neutral Equity Long/Short ETF (ticker: EQLS)
Defiance Pure Electric Vehicle ETF (ticker: EVXX)
Fidelity Disruptive Automation ETF (ticker: FBOT)
Fidelity Disruptive Communications ETF (ticker: FDCF)
Fidelity Disruptive Finance ETF (ticker: FDFF)
Fidelity Disruptive Medicine ETF (ticker: FMED)
Fidelity Disruptive Technology ETF (ticker: FDTX)
Private Real Estate Strategy via Liquid REITs ETF (ticker: PRVT)
T. Rowe Price Capital Appreciation Equity ETF (ticker: TCAF)
T. Rowe Price Growth ETF (ticker: TGRT)
T. Rowe Price Small-Mid Cap ETF (ticker: TMSL)
T. Rowe Price International Equity ETF (ticker: TOUS)
T. Rowe Price Value ETF (ticker: TVAL)
ETF Closures
SPDR® S&P 600 Small Cap ETF (ticker: SLY)
merged into SPDR® Portfolio S&P 600 Small Cap ETF (ticker: SPSM)
Fund/Ticker Changes
None
TETF.Index Performance vs. S&P Financial Select Sector Index
(as of June 16, 2023)
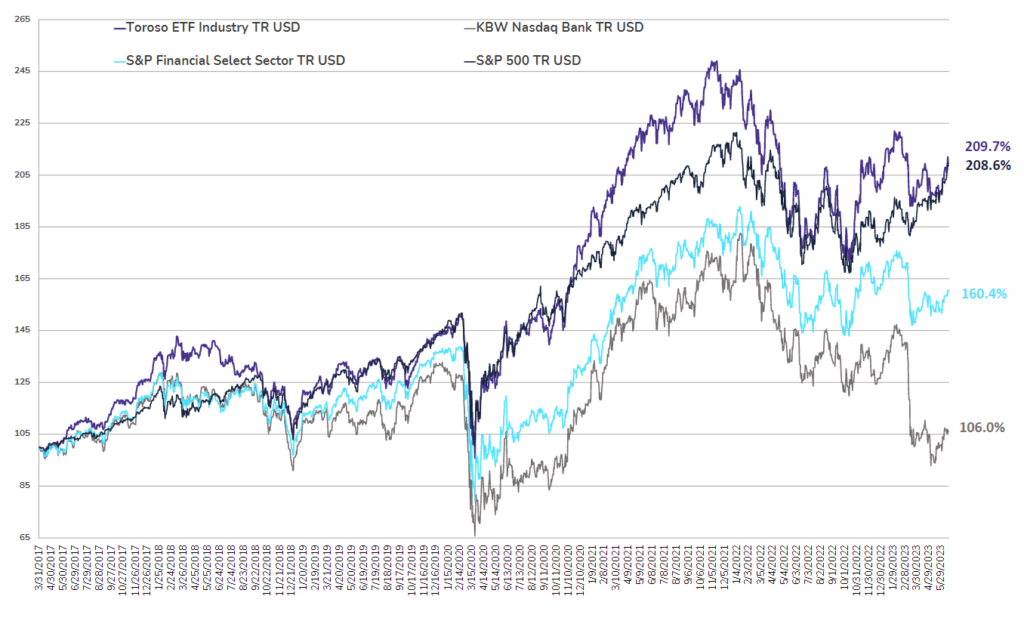
TETF.Index Performance vs. Other Leading Financial Indices
(March 31, 2017 through June 16, 2023)
Why Follow the ETF Industry KPIs
The team at Toroso Investments began tracking the ETF Industry Key Performance Indicators (KPI’s) in the early 2000’s and have been consistently reporting on, and analyzing these metrics ever since. The table above was the impetus for the creation of the TETF.Index, the index that tracks the ETF industry. Each week, we will share the statistics we believe to be the most useful for identifying industry trends, in addition to the performance of the TEFT.Index.
DISCLAIMER
Past performance is no guarantee of future returns. This article is for informational and educational purposes only; is not intended to constitute legal, tax, accounting or investment advice; and does not constitute an offer to sell or a solicitation of an offer to buy any security or service. Furthermore, the Indexes shown above are not investable. While Toroso has gathered the information presented from sources that it believes to be reliable, Toroso cannot guarantee the accuracy or completeness of the information presented and the information presented should not be relied upon as such. Any opinions expressed are Toroso’s opinions and do not reflect the opinions of any affiliates or related persons. All opinions are current only as of the date of initial publication and are subject to change without notice. All investment strategies and investments involve risk of loss, including the possible loss of all amounts invested.