Week of October 23, 2023 KPI Summary
 Ryan Fitzgerald
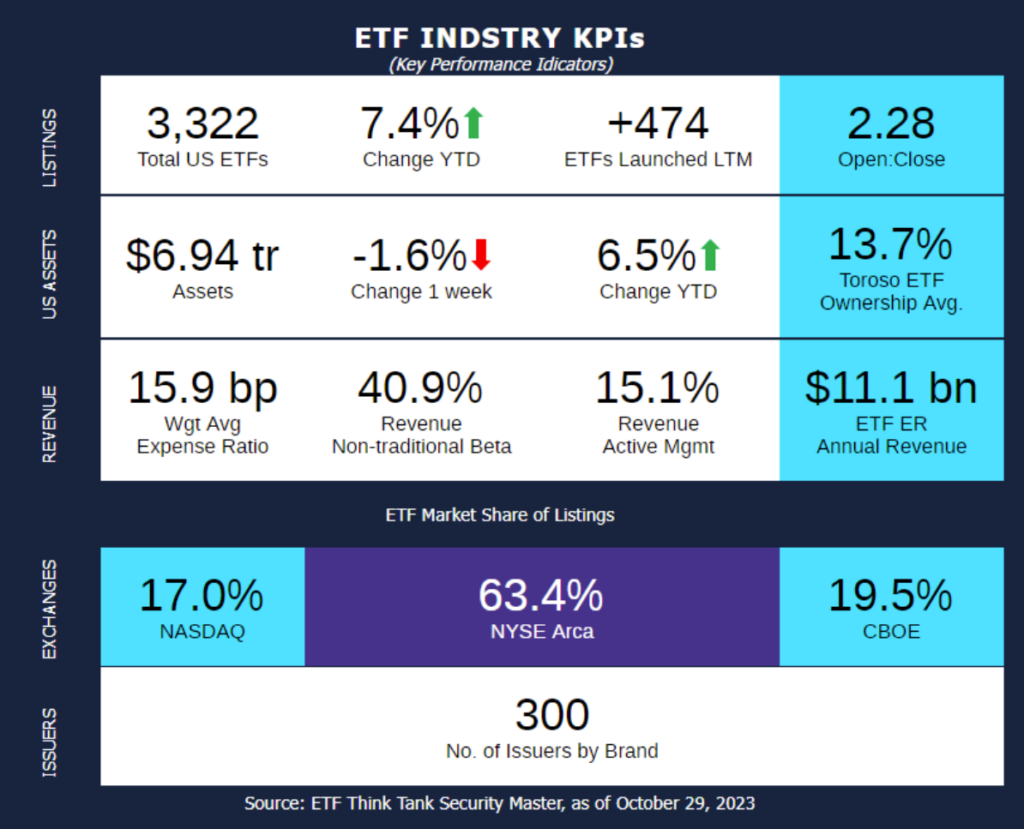
- This week, the industry experienced 12 ETF launches and 9 closures, shifting the 1-year Open-to-Close ratio to 2.28 and total US ETFs to 3,322.
- At the end of July, we were talking about 5 straight months of positive ETF industry asset growth, a record in recent years. Today, we discuss the most recent of the 3-month slide that has ensued. With 2 days left in October, we are going to give our October monthly update and review some notable KPIs (data comparing 10/1/23-10/29/23).
- Total assets decreased -3.3%, there was an increase of 45 ETFs to total US ETF count (3,322), and 6 additional issuers by brand.
- From our 11 asset class categories, Volatility increased the most (11.8%) with Currency next (7.0%). Geared/Swaps had the worst performance (-6.7%) with Preferred Stock at second worst (-6.1%). The two largest asset classes of Equity (75.2% of assets) and Fixed Income (19.6%) plummeted -4.9% and -0.2% respectively.
- This is the third consecutive month with Geared/Swaps in the bottom two performing categories. Additionally, this is back-to -back months of Volatility in the top 2.
- Equity has plunged -4.9% and -4.7% in consecutive months, while Fixed income is merely -0.2% and -1.0%. This has caused Equity to drop from 77.1% to 75.2% of total AUM, but Fixed Income rose from 18.4% to 19.6%.
- The ETF expense ratio annual revenue dropped from $11.5 Bn to $11.1 Bn.
- This is a $1.6 Billion decline over 3 months.
- October followed the trend in September, but less drastic. While assets sank $236 Billion (second worst to September), ETF count and issuers took a relatively big jump once again. It was the second most ETFs gained and second most Issuers, noteworthy to mention in a 4 weeklong monthly update, too.
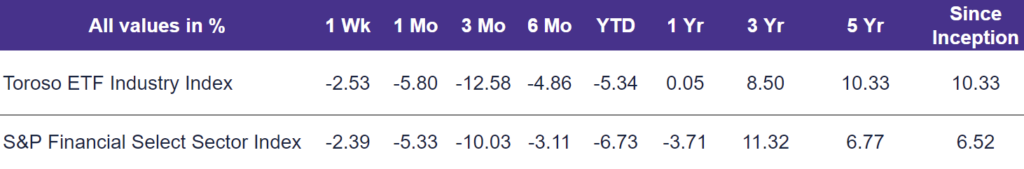
- The tracked indexes had very similar experiences in October. The Toroso ETF Industry Index was down -5.8% while the S&P Financial Select Sector Index led at -5.3%.
ETF Launches
Kurv Yield Premium Strategy Apple (AAPL) ETF (ticker: AAPY)
Kurv Yield Premium Strategy Netflix (NFLX) ETF (ticker: NFLP)
Kurv Yield Premium Strategy Tesla (TSLA) ETF (ticker: TSLP)
FT Cboe Vest U.S. Equity Moderate Buffer ETF – October (ticker: GOCT)
FT Cboe Vest U.S. Equity Enhance & Moderate Buffer ETF – October (ticker: XOCT)
FT Cboe Vest Laddered Moderate Buffer ETF (ticker: BUFZ)
BlackRock Large Cap Core ETF (ticker: BLCR)
Goldman Sachs Nasdaq-100 Core Premium Income ETF (ticker: GPIQ)
Goldman Sachs S&P 500 Core Premium Income ETF (ticker: GPIX)
Parametric Equity Premium Income ETF (ticker: PAPI)
Xtrackers USD High Yield BB-B Ex Financials ETF (ticker: BHYB)
YieldMax MRNA Option Income Strategy ETF (ticker: MRNY)
ETF Closures
AdvisorShares Dorsey Wright Micro-Cap ETF (ticker: DWMC)
Principal Millennial Global Growth ETF (ticker: GENY)
JPMorgan ActiveBuilders International Equity ETF (ticker: JIDA)
Janus Henderson Net Zero Transitionn Resources ETF (ticker: JZRO)
AdvisorShares Let Bob AI Powered Momentum ETF (ticker: LETB)
Strategy Shares Halt Climate Change ETF (ticker: NZRO)
Principal US Large-Cap Adaptive Multi-Factor ETF (ticker: PLRG)
Principal US Small-Cap Adaptive Multi-Factor ETF (ticker: PLTL)
Principal International Adaptive Multi-Factor ETF (ticker: PXUS)
Fund/Ticker Changes
None
TETF.Index Performance vs. S&P Financial Select Sector Index
(as of October 27, 2023)
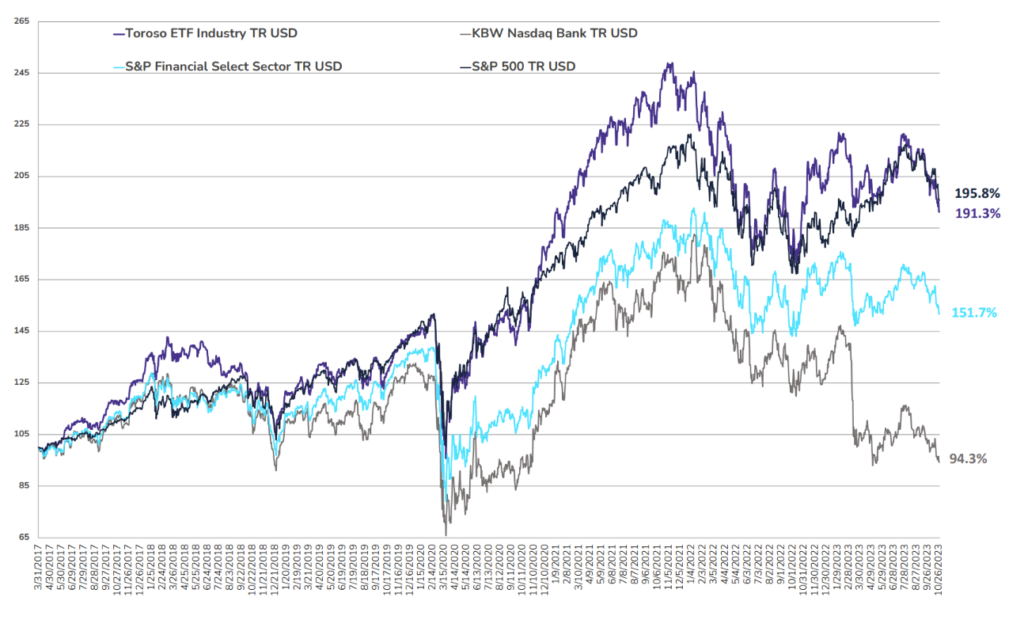
TETF.Index Performance vs. Other Leading Financial Indices
(March 31, 2017 through October 27, 2023)
Why Follow the ETF Industry KPIs
The team at Toroso Investments began tracking the ETF Industry Key Performance Indicators (KPI’s) in the early 2000’s and have been consistently reporting on, and analyzing these metrics ever since. The table above was the impetus for the creation of the TETF.Index, the index that tracks the ETF industry. Each week, we will share the statistics we believe to be the most useful for identifying industry trends, in addition to the performance of the TEFT.Index.
DISCLAIMER
Past performance is no guarantee of future returns. This article is for informational and educational purposes only; is not intended to constitute legal, tax, accounting or investment advice; and does not constitute an offer to sell or a solicitation of an offer to buy any security or service. Furthermore, the Indexes shown above are not investable. While Toroso has gathered the information presented from sources that it believes to be reliable, Toroso cannot guarantee the accuracy or completeness of the information presented and the information presented should not be relied upon as such. Any opinions expressed are Toroso’s opinions and do not reflect the opinions of any affiliates or related persons. All opinions are current only as of the date of initial publication and are subject to change without notice. All investment strategies and investments involve risk of loss, including the possible loss of all amounts invested.