Week of October 4, 2021 KPI Summary
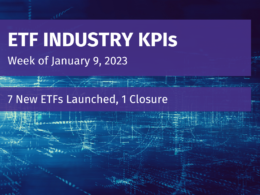
- This week, the industry experienced 23 new ETF launches and 2 closures, shifting the 2021 YTD Open-to-Close ratio to 3.30 and total US ETFs to 2,697.
- As the 3rd Quarter of 2021 has wrapped up, let’s take a look at some influential KPIs.
- Total ETFs were up 110 (+4.12%) and total assets increased $81.8 Billion (+1.24%).
- The two best performing sectors were Options (13.48%) and Allocation (8.95%) and worst performing sectors were Commodities Physical (-6.02%) and Currency (-2.72%).
- The two largest sectors, Equity and Fixed Income, increased 0.69% and 3.83% respectively.
- In the Exchanges, although NYSE increased its total listings by 84 ETFs, its share of total ETF assets dropped 0.29% (from 75.12% to 74.83%), which Nasdaq absorbed to make their slice of ETF assets 17.86%.
- Number of Issuers by Brand grew from 196 to 219.
- The 2021 3rd quarter certainly slowed down the rise in assets, but the surge in launches have pushed the universe to new heights with new, innovative funds and issuers emerging.
- Both indexes experienced change in 2021 Q3 (7/1/2021 to 10/1/2021), Toroso ETF Industry Index was up 1.00% while the S&P Financial Select Sector Index led at 3.57%.

ETF Launches
First Trust SkyBridge Crypto Industry & Digital Economy ETF (ticker: CRPT)
abrdn Bloomberg Industrial Metals Strategy K-1 Free ETF (ticker: BCIM)
Avantis® Emerging Markets Value ETF (ticker: AVES)
Avantis® International Large Cap Value ETF (ticker: AVIV)
Avantis® Real Estate ETF (ticker: AVRE)
Direxion Daily Select Large Caps & FANGs Bull 2X Shares (ticker: FNGG)
KraneShares California Carbon Allowance ETF (ticker: KCCA)
KraneShares European Carbon Allowance ETF (ticker: KEUA)
JPMorgan Active Value ETF (ticker: JAVA)
VictoryShares ESG Core Plus Bond ETF (ticker: UBND)
VictoryShares ESG Corporate Bond ETF (ticker: UCRD)
VictoryShares THB Mid Cap ESG ETF (ticker: MDCP)
ETFMG 2X Daily Inverse Alternative Harvest ETF (ticker: MJIN)
Fidelity® Clean Energy ETF (ticker: FRNW)
Fidelity® Cloud Computing ETF (ticker: FCLD)
Fidelity® Digital Health ETF (ticker: FDHT)
Fidelity® Electric Vehicles & Future Transportation ETF (ticker: FDRV)
VanEck Morningstar ESG Moat ETF (ticker: MOTE)
WisdomTree Target Range Fund (ticker: GTR)
KraneShares China Innovation ETF (ticker: KGRO)
Invesco Alerian Galaxy Crypto Economy ETF (ticker: SATO)
Invesco Alerian Galaxy Blockchain Users & Decentralized Commerce ETF (ticker: BLKC)
Simplify Health Care ETF (ticker: PINK)
ETF Closures
Trend Aggregation US ETF (ticker: TAEQ)
Trend Aggregation Conservative ETF (ticker: TACE)
TETF.Index Performance vs. S&P Financial Select Sector Index
(as of October 8, 2021)

TETF.Index Performance vs. Other Leading Financial Indices
(March 31, 2017 through October 8, 2021)

Source: Morningstar Direct
Why Follow the ETF Industry KPIs
The team at Toroso Investments began tracking the ETF Industry Key Performance Indicators (KPI’s) in the early 2000’s and have been consistently reporting on, and analyzing these metrics ever since. The table above was the impetus for the creation of the TETF.Index, the index that tracks the ETF industry. Each week, we will share the statistics we believe to be the most useful for identifying industry trends, in addition to the performance of the TEFT.Index.
DISCLAIMER
Past performance is no guarantee of future returns. This article is for informational and educational purposes only; is not intended to constitute legal, tax, accounting or investment advice; and does not constitute an offer to sell or a solicitation of an offer to buy any security or service. Furthermore, the Indexes shown above are not investable. While Toroso has gathered the information presented from sources that it believes to be reliable, Toroso cannot guarantee the accuracy or completeness of the information presented and the information presented should not be relied upon as such. Any opinions expressed are Toroso’s opinions and do not reflect the opinions of any affiliates or related persons. All opinions are current only as of the date of initial publication and are subject to change without notice. All investment strategies and investments involve risk of loss, including the possible loss of all amounts invested.