Week of September 25, 2023 KPI Summary
 Ryan Fitzgerald
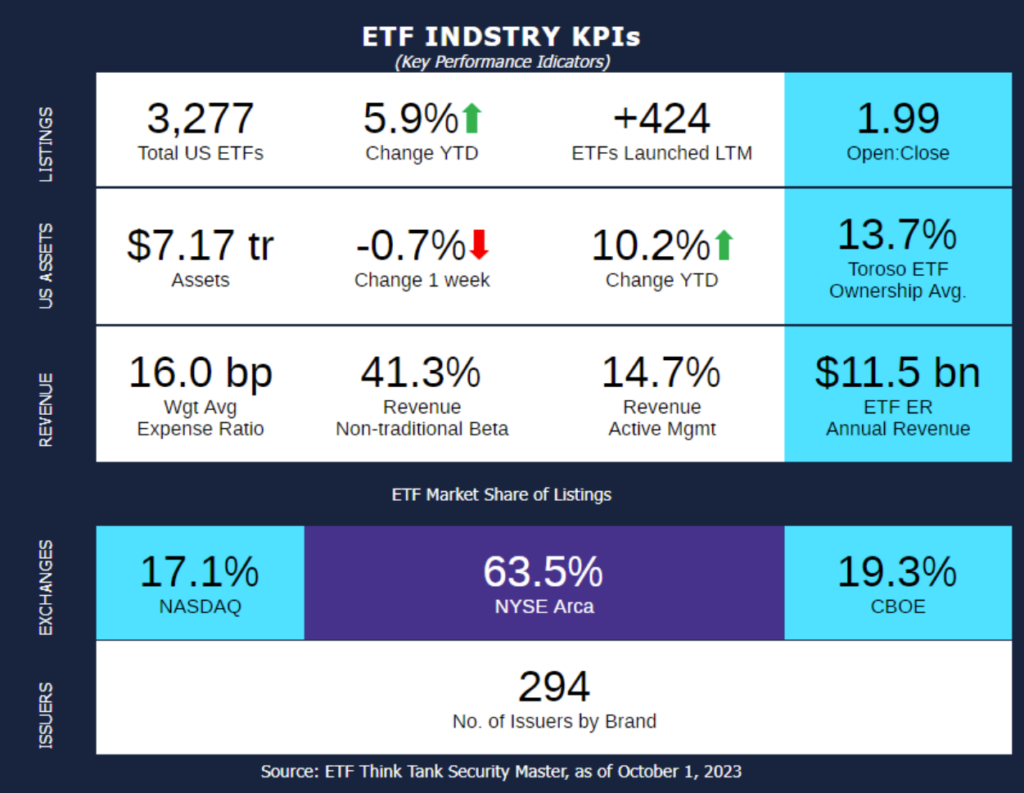
- This week, the industry experienced 21 ETF launches and 1 closure, shifting the 1-year Open-to-Close ratio to 1.99 and total US ETFs to 3,277.
- As we wrote about last week, September is the start of the Fall season, and it looks like that’s just what assets did: Fell. Let’s review our notable KPIs from September (data comparing 9/4/23-10/1/23).
- Total assets decreased -3.9%, there was an increase of 62 ETFs to total US ETF count (3,277), and 4 additional issuers by brand.
- From our 11 asset class categories, Managed Futures increased the most (17.8%) with Volatility next (4.3%). Geared/Swaps had the worst performance (-9.3%) with Commodities Physical at second worst (-5.8%). The two largest asset classes of Equity (76.5% of assets) and Fixed Income (19.0%) plummeted -4.7% and -1.0% respectively.
- Managed Futures has consecutive months as the top performing category and there are also consecutive months with Geared/Swaps in the bottom two. Meanwhile, Volatility flipped from worst in August to second best in September.
- Lastly, Options was top 2 in July and August and 3rd best in September (+2.1%).
- The ETF expense ratio’s annual revenue dropped from $12.0 Bn to $11.5 Bn.
- This is a $1.2 Billion decline over 2 months.
- September was a very interesting month in the ETF industry. Total assets plunged $300 Billion, yet total ETFs took a massive jump with 70 launches and 8 closures. This +62 is by far the most in one month (really just 4 weeks) this year with +34 (August) being the next highest. The closest month in the last 2 years was December 2021 with +57 ETFs. On the other hand, assets declining 3.9% make September the worst month of 2023 and the worst since September of 2022 (-6.7%).
- We will also proudly mention Tidal is one party responsible for helping this massive jump in August and September launches; There have been 116 total ETF launches in the last 2 months.
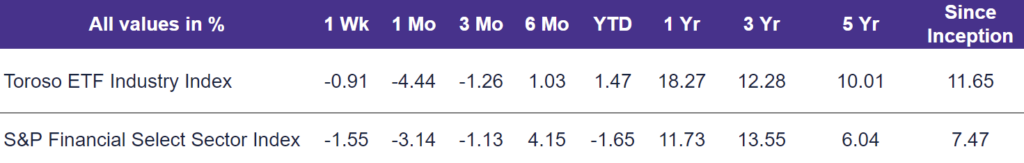
- The tracked indexes had very similar experiences in September. The Toroso ETF Industry Index was down -4.44% while the S&P Financial Select Sector Index led at -3.14%.
ETF Launches
Avantis U.S. Large Cap Equity ETF (ticker: AVLC)
BlackRock Advantage Large Cap Income ETF (ticker: BALI)
Brookstone Active ETF (ticker: BAMA)
Brookstone Intermediate Bond ETF (ticker: BAMB)
Brookstone Dividend Stock ETF (ticker: BAMD)
Brookstone Growth Stock ETF (ticker: BAMG)
Brookstone Opportunities ETF (ticker: BAMO)
Brookstone Ultra-Short Bond ETF (ticker: BAMU)
Brookstone Value Stock ETF (ticker: BAMV)
Brookstone Yield ETF (ticker: BAMY)
Capital Group Core Balanced ETF (ticker: CGBL)
Capital Group Core Bond ETF (ticker: CGCB)
Capital Group Dividend Growers ETF (ticker: CGDG)
Capital Group International Equity ETF (ticker: CGIE)
Capital Group Short Duration Municipal Income ETF (ticker: CGSM)
Dimensional World Equity ETF (ticker: DFAW)
Dimensional Ultrashort Fixed Income ETF (ticker: DUSB)
GGM Macro Alignment ETF (ticker: GGM)
JPMorgan Hedged Equity Laddered Overlay ETF (ticker: HELO)
YieldMax PYPL Option Income Strategy ETF (ticker: PYPY)
iShares Transition-Enabling Metals ETF (ticker: TMET)
ETF Closures
JPMorgan ActiveBuilders U.S. Large Cap Equity ETF (ticker: JUSA)
Fund/Ticker Changes
None
TETF.Index Performance vs. S&P Financial Select Sector Index
(as of September 29, 2023)
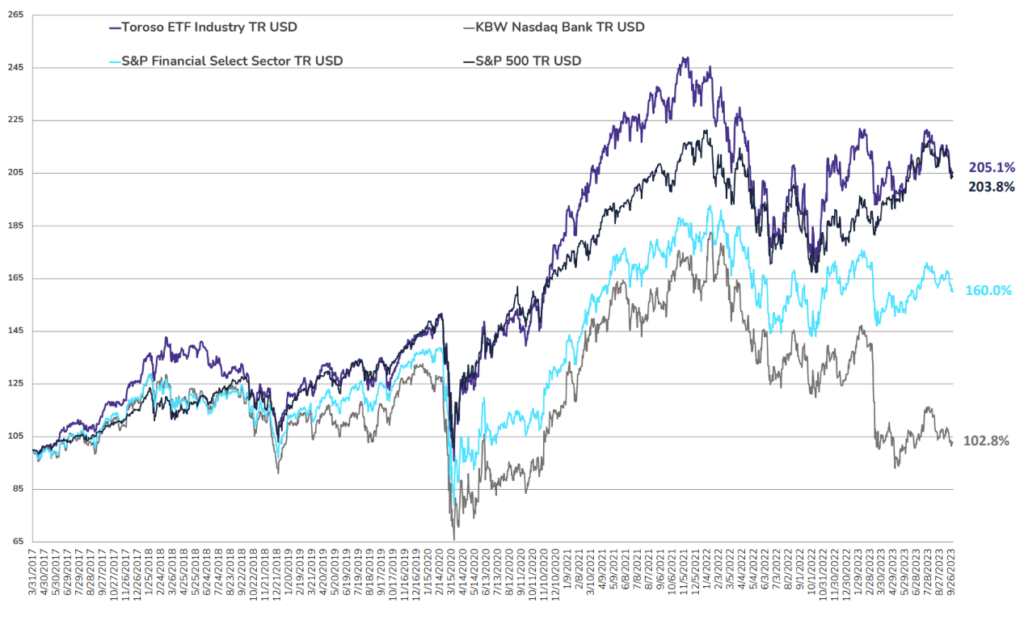
TETF.Index Performance vs. Other Leading Financial Indices
(March 31, 2017 through September 29, 2023)
Why Follow the ETF Industry KPIs
The team at Toroso Investments began tracking the ETF Industry Key Performance Indicators (KPI’s) in the early 2000’s and have been consistently reporting on, and analyzing these metrics ever since. The table above was the impetus for the creation of the TETF.Index, the index that tracks the ETF industry. Each week, we will share the statistics we believe to be the most useful for identifying industry trends, in addition to the performance of the TEFT.Index.
DISCLAIMER
Past performance is no guarantee of future returns. This article is for informational and educational purposes only; is not intended to constitute legal, tax, accounting or investment advice; and does not constitute an offer to sell or a solicitation of an offer to buy any security or service. Furthermore, the Indexes shown above are not investable. While Toroso has gathered the information presented from sources that it believes to be reliable, Toroso cannot guarantee the accuracy or completeness of the information presented and the information presented should not be relied upon as such. Any opinions expressed are Toroso’s opinions and do not reflect the opinions of any affiliates or related persons. All opinions are current only as of the date of initial publication and are subject to change without notice. All investment strategies and investments involve risk of loss, including the possible loss of all amounts invested.