
The Economy is Booming, and Possibly Busting
Amidst a period of robust economic resurgence (before revisions), there are indications of a looming credit crunch that warrant careful consideration. The stock market, the economy, and debt markets are unique beasts. While the first two are currently experiencing significant growth, the third continues to falter. Robust growth, strong consumer spending, and positive real wage growth (after accounting for inflation) have proven the economy resilient after shrugging off the regional banking crisis. However, an ever-surmounting wall of corporate and government debt continues to kick the can down the road in hopes of issuing debt at more favorable terms than what is available today. Credit spreads are, thus, artificially suppressed. Investors are eager for income, but face a lack of corporate issuance, and a still inverted yield curve. Listening to Bill Ackman denounce 30-year treasuries expecting yields to hit 5.5%, it is very much boom and bust in today’s markets and economy. While rates are, on average, expected to decrease next year, it’s really a tale of two coins: those who expect H4L interest rates (higher 4 Longer – ala Ackman) and those in the deflationary camp (deflationary in both CPI and stock earnings – leading to a recession) that blends into an expectation of modest drops in interest rates to come.
The Economy
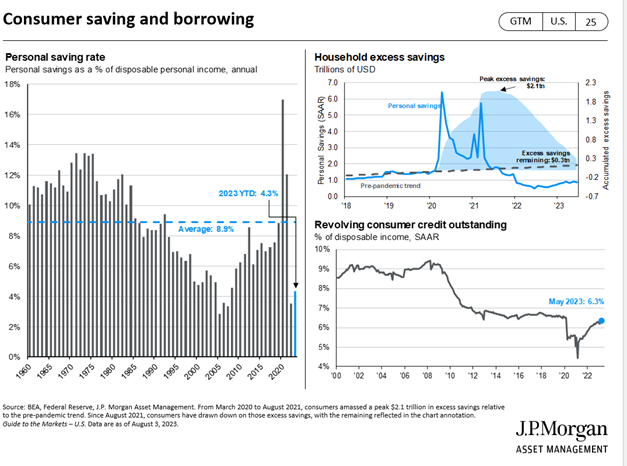
Our economy is currently demonstrating robust growth, with several key indicators pointing towards positive momentum. Notably, real GDP increased 2.4% quarter over quarter further underscored by the upward trajectory in new orders for both durable goods and core capital goods, illustrating healthy demand across key sectors. Consumer spending, evidenced by PCE, came in at 2.9% for June, with a rebound in goods consumption. Real wages, adjusted for inflation, turned positive. Personal income came in at 6.2%, the highest since September last year, when inflation was much more rampant. Household debt, as a percentage of disposable income, is right around its 10-year average. Credit card debt, while elevated, is still below its 10-year average. While these seem rosy, economic forecasts are proving to be less and less accurate, as estimate variance grows given the substantial drop in data points gathered, and economic seasonality still reverberating from the Covid aftershock.
The Market
This year, the market landscape has undergone remarkable growth, largely fueled by the phenomenon of stock multiple expansion. A sharp contrast to the previous year, which was marked by cautious earnings calls and bleak future guidance from CEOs; the narrative has shifted significantly. This year it’s a race to mention Artificial Intelligence as many times as possible so those same NLP’s can count how many times big tech says AI and give allocators more assurance to increase allocations. We believe the current record is 124 times in one earnings call, but we are expecting someone to break 150 references to artificial intelligence in next quarter’s earnings calls. We are very bullish on AI reference counts in quarterly calls. Much less bullish on earnings expectations!
To all those who quote percentage of companies that beat estimates, see below!! We love this chart. Here are forward-looking earnings expectations of the S&P 500 over time (Q+7 means that is next quarter’s estimate, 7 quarters from now, 2 years ahead). You can see over time how lofty earnings estimates become.
The S&P 500 Index was just 2 years away from $250 annualized earnings at the end of 2021 (yes, your math is right, that would mean in Q4 of 2023, the S&P 500 would have $62.5 dollars in quarterly earnings, or $250 annualized). Coincidentally, we were ALSO two years away from $62.5 dollars in quarterly earnings in April 2023! That timeline has since sped up, and we are currently 18 months away from $62.5 a quarter / $250 annualized.
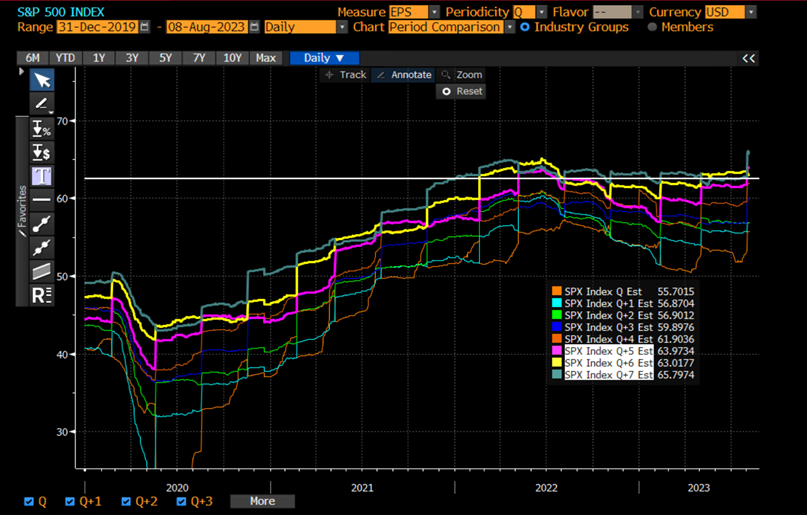
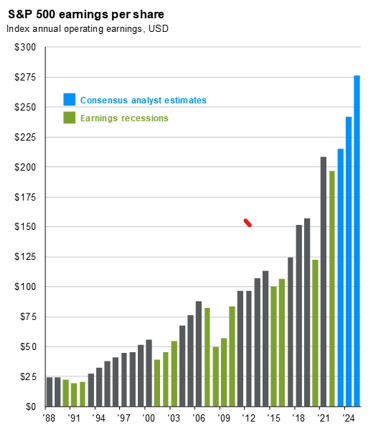
Guide to the Markets – U.S. Data are as of August 3, 2023.
The challenge is, if earnings come in that hot to start next year, rates are unlikely to drop, and big portions of the debt market will be at risk of total catastrophe, as they will not be able to refinance without destroying most of the equity in their business with increased interest expenses gobbling up income. Unlike US residential real estate, 30-year debt is not an option for most businesses. This isn’t just commercial real estate. These are public companies with high-yield debt ratings, legacy private equity companies, and the growing world of private credit.
Labor
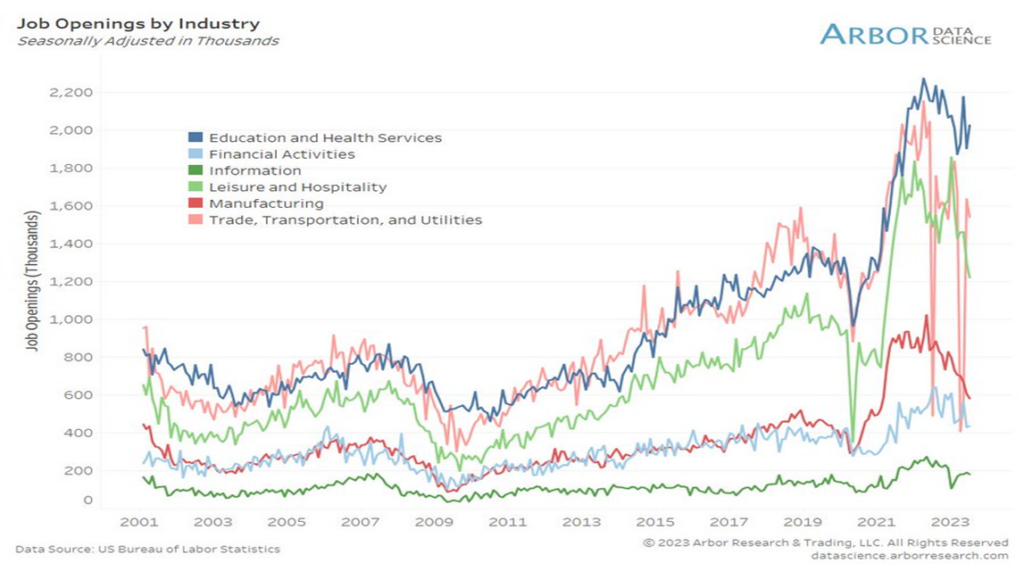
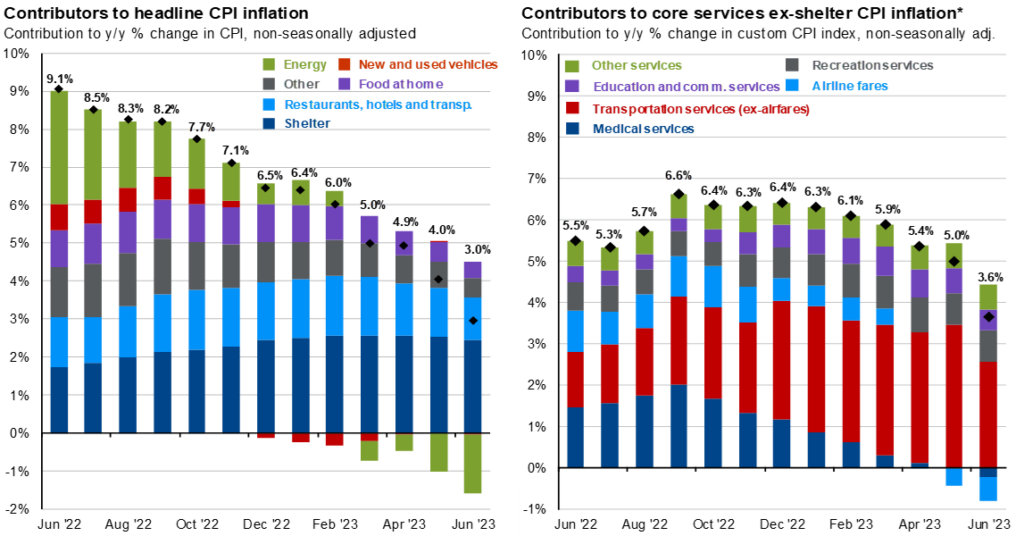
While earnings have been strong, there has been a bit of cooling off in labor data, suggesting potential deceleration in job growth. While everyone talks about technology layoffs, the overall impact it has had within the overall workforce of tech is minimal. The technology sector employs a very low percentage of the overall workforce, and these companies were on a decade-long hiring spree that will not be unwound in 2 quarters, regardless. Outside of tech, there has been a bit of labor hoarding by employers after having such a difficult time hiring in 2020. Employers have preferred to minimize overtime (evidenced by a drop in the average work week) instead of firing employees. It does appear the Leisure and Hospitality sectors are cooling off, while Trade, Transportation, Utilities, Education, and Healthcare remain red hot. Some say the shift back to durable goods is to replace services (hello AI!), which has gotten too expensive for some.
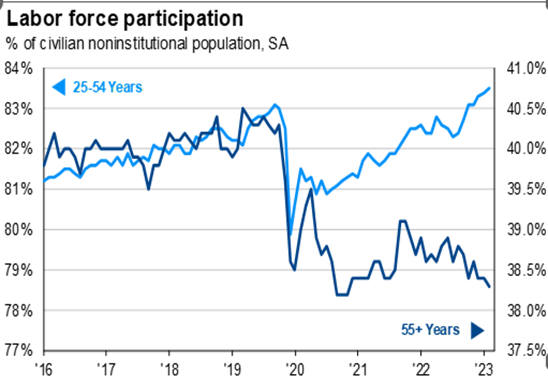
It’s interesting to note the divergence in labor force participation below and above 55 years of age. 25-54 has surged back beyond pre covid levels while above 55 is close to all-time Covid lows.

Inflation
Expectations are such that we are setting up for a very gradual and orderly decrease in CPI in 2024. Similar to rates, it’s not that many truly believe this to be the case, rather that there are somewhat equal bets on either side of the H4L / deflation camps mentioned above.
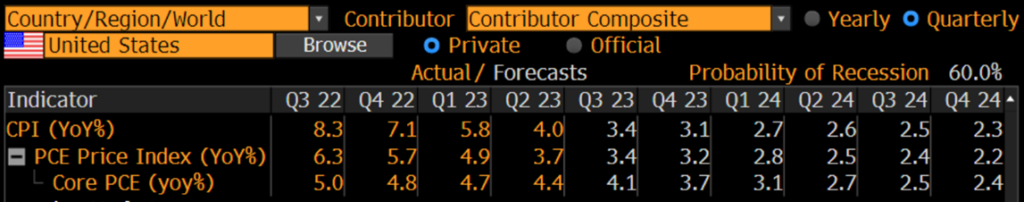
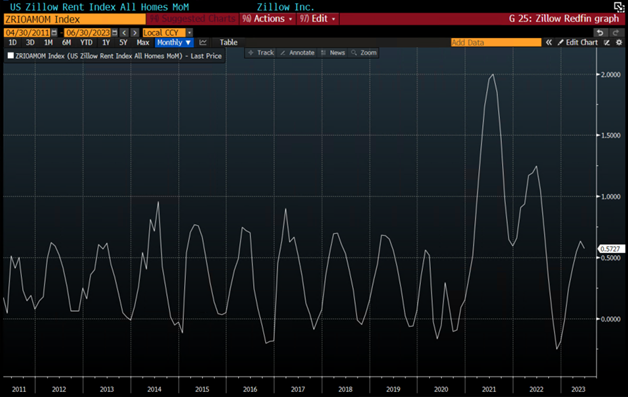
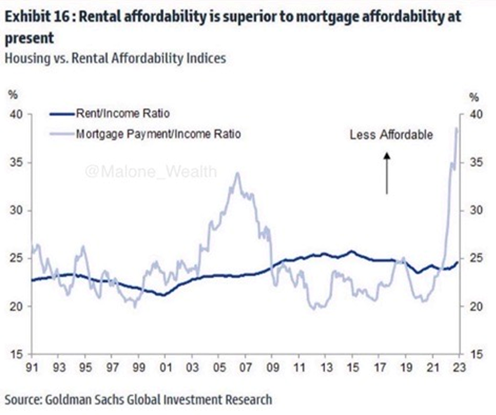
Whether secular, transitory, or magical in nature, inflation is more likely to fluctuate as weather, wars and geopolitical interests don’t really have the same agenda as the Fed. We are beginning to see a backlog of multifamily properties and increasing rental vacancies. It’s already much cheaper to be a renter than a new homeowner in this market. If rent falls, who knows what could occur in residential real estate prices.
Guide to the Markets – U.S. Data are as of August 3, 2023.
The Dollar
While the dollar remains the world’s reserve currency offering a safe haven in moments of illiquidity, there is a possibility of continued gradual downturn. Fitch recently downgraded US credit to AA+, which was ultimately shrugged off by markets. Jamie Dimon views this as a non-event, as our dollar is primarily backed by our military force. Wars are now occurring via access to natural resources, and economic warfare such as tariffs, reserves, and trade settlements.
In Summary
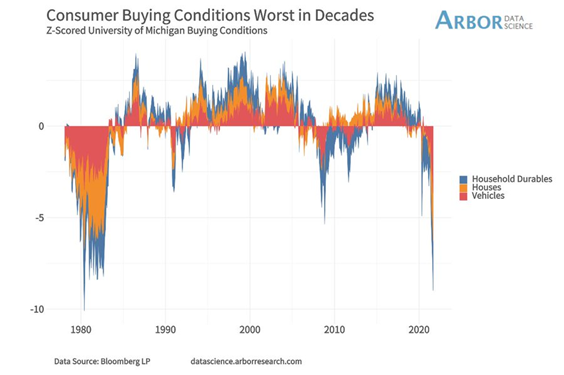
Although the economy has experienced a notable rebound, there is still downside earnings risk, and longer-term risks to debt markets unless interest rates lower. Savings rates are low; almost all excess savings built up through Covid are gone, and we are in the worst buying conditions for Houses & Vehicles since the 80s. Odds are we see a recession before we see $250 in quarterly earnings in the S&P 500. AI can and will increase productivity, as will other future technologies, but not without some volatility first.
US Equity
The top 10 stocks reached an all-time high in terms of concentration in the S&P 500, reaching 31.6%. After a record first half, the NASDAQ 100 Index had to issue a special rebalance due to overconcentration in its top 5 names. The top 10 companies in the S&P 500 returned 13.8% of the 14.9% return on the Index YTD. The performance of Apple, Microsoft, Alphabet (Google), Tesla, Meta, and Nvidia have kept active managers awake at night worrying about their relative allocation, further exacerbating the situation by those catching up in weight.
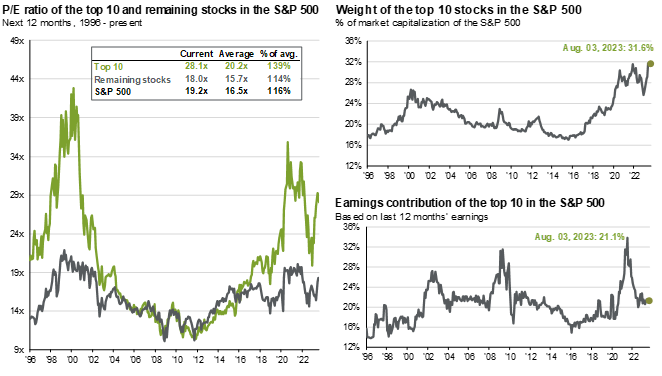
The top 10 S&P 500 companies are based on the 10 largest index constituents at the beginning of each month. As of 6/30/2023, the top 10 companies in the index were AAPL (7.7%), MSFT (6.8%), AMZN (3.1%), NVDA (2.8%), GOOGL (1.9%), TSLA (1.9%), Meta (1.7%), GOOG (1.7%), BRK.B (1.6%), UNH (1.2%) and XOM (1.2%). The remaining stocks represent the rest of the 494 companies in the S&P 500.
Guide to the Markets – U.S. Data are as of August 3, 2023.
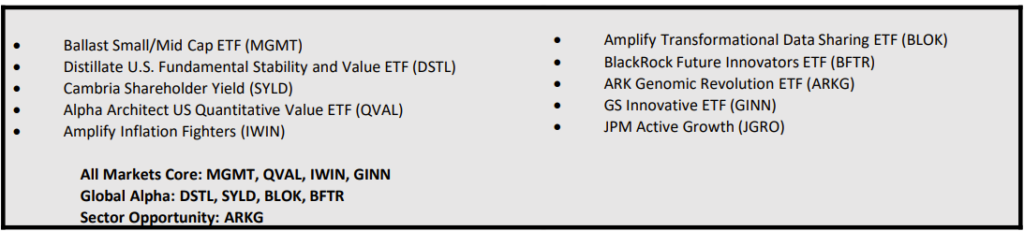
A combination of quality and value, with some non-megacap growth is optimal for a defensive stance.
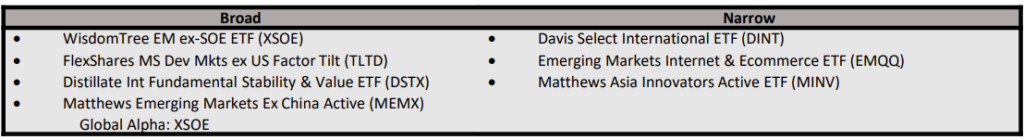
International Developed and Emerging Market Equity
As of July, the iShares MSCI EAFE ETF (EFA) has returned 15.54%, while the iShares MSCI Emerging Markets ETF (EEM) returned 11.56%. While the China reopening trade appears to have completely faltered, there is still a lot to like in emerging markets. While inflation numbers are still a bit higher in parts of Europe, they are faced with similar issues of strong economic growth coupled with significant concerns around debt markets, albeit at a substantial discount in multiples.
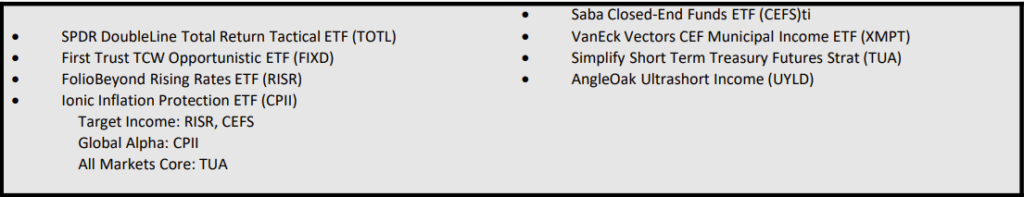
Fixed Income
Fixed Income gave back much of the gains it experienced earlier this year, and while the yield curve is still inverted, it has retraced a lot of the gains from Q1. With inflation risks seemingly subdued, a hedge against a potential uptick could be prudent.
Alternatives
Amidst the evolving economic landscape, the dollar remains in a state of decline, while gold hovers up around 6% on the year. Bitcoin has experienced a rebound, fueled by a gold-like rally post-banking crisis, as its hedge against the credit worthiness of nations came into play. It took another leg up with news of Blackrock filing an ETF. The next leg will likely have to wait for some sort of monetary or fiscal spending budget, or an increase in the Fed’s balance sheet.
A Hypothetical High-Active-Share Reconstruction of a Traditional 60/40
- 5% Angel Oak Ultra Short Income ETF (UYLD)
- 2% Simplify Short Term Treasury Futures (TUA)
- 4% Simplify Managed Futures (CTA)
- 10% Saba Closed-End Funds ETF (CEFS)
- 2.5% AGFiQ US Market Neutral Anti-Beta Fund (BTAL)
- 1% Ionic Inflation Protection ETF (CPII)
- 1% FolioBeyond Rising Rates ETF (RISR)
- 2.5% WisdomTree Enhanced Commodity Strategy Fund (GCC)
- 1% Teucrium Agricultural Strategy No K-1 ETF (TILL)
- 4% SPDR Gold MiniShares Trust (GLDM)
- 4% Amplify Inflation Fighters ETF (IWIN)
- 5% Amplify Transformational Data Sharing ETF (BLOK)
- 5% SoFi Be Your Own Boss ETF (BYOB)
- 5% Franklin Disruptive Commerce ETF (BUYZ)
- 5% BlackRock Future Innovators ETF (BFTR)
- 4% Ark Genomic Revolution ETF (ARKG)
- 4% Matthews Emerging Markets ex China ETF (MEMX)
- 5% Ballast Small/Mid Cap ETF (MGMT)
- 5% ETF 6 Meridian Small Cap Equity ETF (SIXS)
- 5% Alpha Architect US Quantitative Value ETF (QVAL)
- 5% Cambria Shareholder Yield ETF (SYLD)
- 5% Distillate International Fundamental Stability Value ETF (DSTX)
- 2.5% Distillate US Fundamental Stability & Value ETF (DSTL)
- 2.5% Goldman Sachs Innovative Equity ETF (GINN)
- 5% Matthews Asia Innovators Active ETF (MINV)
Disclosure
All investments carry risks, and investors may lose their principal.
The material provided here is for informational purposes only and should not be considered personalized investment advice. The investment strategies mentioned here may not be suitable for everyone, and each investor should review their own situation before making an investment decision.
Opinions expressed here are subject to change without notice due to market conditions. Third-party data presented here is obtained from sources believed to be reliable, but accuracy, completeness, or reliability cannot be guaranteed.
The examples provided are for illustrative purposes only and should not be considered reflective of actual results.
Investments’ value and income can fluctuate, and investors may not recover their initial investment. Factors that can affect investments include interest rate changes, exchange rate fluctuations, general market conditions, political, social, and economic developments, and other variable factors. Investment carries risks, such as payment delays, and loss of income or capital. Neither Toroso nor any of its affiliates guarantee any rate of return or the return of capital invested.
This commentary material is for informational purposes only and does not constitute an offer to sell or a solicitation of an offer to buy any security.
All investments and investment strategies carry risks of loss, including the possible loss of all amounts invested, and nothing herein should be construed as a guarantee of any specific outcome or profit. While we have gathered information from sources we believe to be reliable, we cannot guarantee the accuracy or completeness of the information presented.
The information in this material is confidential and proprietary and may only be used by the intended user. Toroso, its affiliates, or any of their officers or employees are not liable for any losses arising from the use of this material or its contents. This material may not be reproduced, distributed, or published without prior written permission from Toroso. Distribution of this material may be restricted in certain jurisdictions. Anyone receiving this material should seek advice to determine whether there are any restrictions in their jurisdiction.