You Can’t Beat the Q’s Without Joining Them
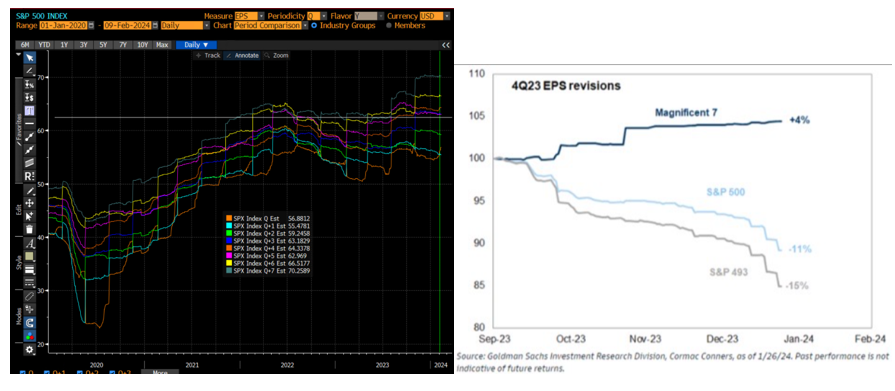
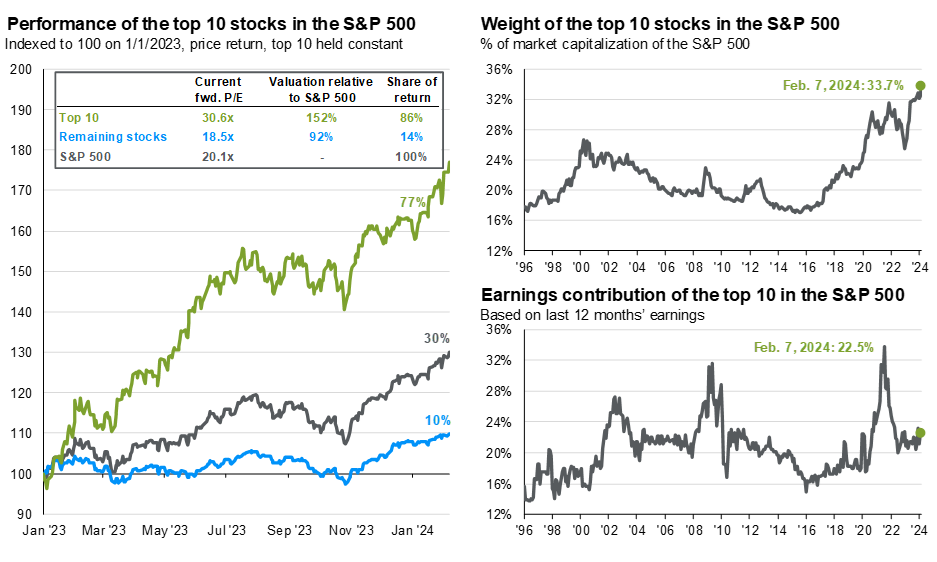
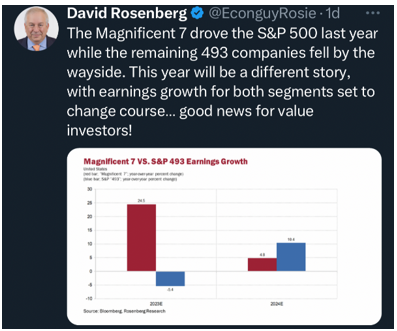
Much has been written about the dominance of passive indexing flows and the concentration that has formed, now labeled the “Magnificent 7” (and potentially repositioned the “Magnificent 6” in 2024 if Tesla doesn’t pick up the slack). Their growth in allocation within passive indexes continues to defy gravity so much so that last year, Nasdaq systematically trimmed some of the larger positions, as they were heading towards concentration limits that triggered an index rebalance. Probably not the last we will see of that. Active equity managers are left trying to keep up as these monopolies gobble up profits across the industry, fighting their own concentration limits It’s been noted that the S&P 500 has not reached the $250 earnings milestone as previously anticipated.. Current projections suggest that we are still a year away from our first quarterly earnings above $250 (Q3 shows estimates at $63.18, where 250/4=$62.5). Growth rates are typically at or close to double digits on a forward-looking basis, and trend downward to a more realistic level leading up to earnings. It’s a fun game. It’s interesting to see on the right that the Magnificent 7 Q4 earnings were not being revised down with the rest of the index. Onward and upward goes the Qs! While valuations might feel like the late 2000s, these are superb and diverse businesses (mostly).
In late summer of last year, investors watched with concern as yields rose to unexpected levels, followed by a notable decrease in long-term yields by 1.2%, pulling most investable assets along. November was the best month for the Barclays Aggregate Index in 30 years.
What caused such a crazy turn? A combination of monetary policies—referred to by the soup of acronyms like QRA, TGA, RRP, R-Star—and the behavior of inflation, which, based on recent observations, might have been more temporary than initially expected.
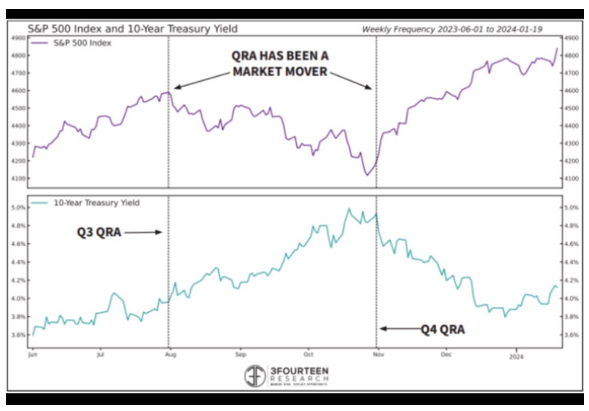
The Quarterly Refunding Announcement (QRA) states how much and at what maturity issuance and net issuance will be to fund deficits. It’s the macro-economists new favorite guessing game. QRA 5 came and went with little effect but was not available on this chart. Most importantly above, QRA 4 was essentially its own form of quantitative easing where the government did what many corporations and some households have done over the last year: kicked the debt can down the road. For the government and the QRA, that means a shift towards issuing more short-term debt, or bills. This means we will have more and more debt issuance to roll over in the coming years. QRA 4 was the turning point where stocks and bonds became highly correlated again after a divergence post QRA 3.
Transitory Inflation -> High Inflation -> Transitory Inflation – > Sticky / Stagflation prior to deflation?
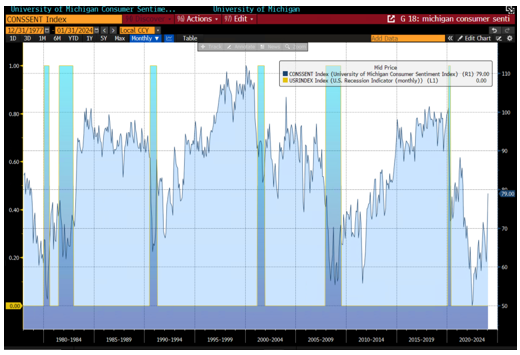
Whether you look at CPI, core CPI, PCE, core PCE, revisions or not, inflation is currently down from its peaks. The most recent print came in higher due to insurance and shelter primarily. Equity and duration correlation was temporarily negative until this last inflation point. While inflation has gone down, wage growth is still strong. Wages are strong, economic activity is robust (strong GDP), and financial conditions are easing; this is why you are seeing the S&P 500 defy gravity in 2024.
Real Estate
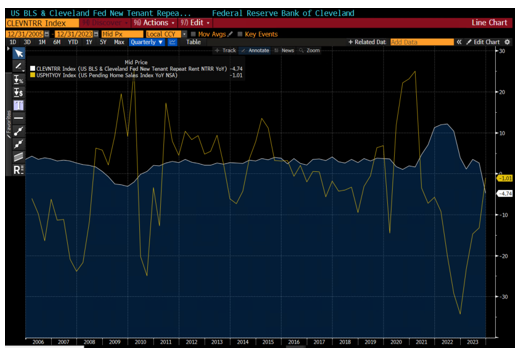
Pending home sales have been declining at a decreasing rate, and now are almost flat. This is bullish. Owners’ Equivalent Rent (OER), not shown below, is still ticking higher, but a more forward-looking indicator to OER, New Tenant Index, is seeing a drawdown last experienced in 08-09. If you are confused, so are we.
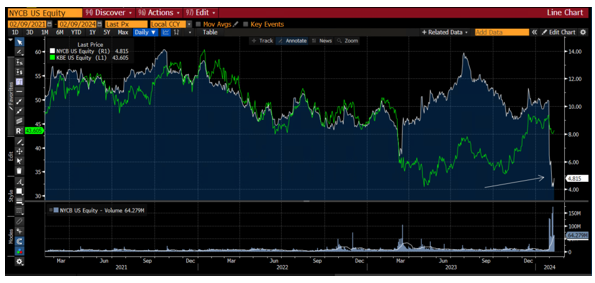
The banking crisis last year was an issue of duration, whereas this year it is credit worthiness. Below is a chart of New York Community Bank and the S&P Bank ETF (KRE).
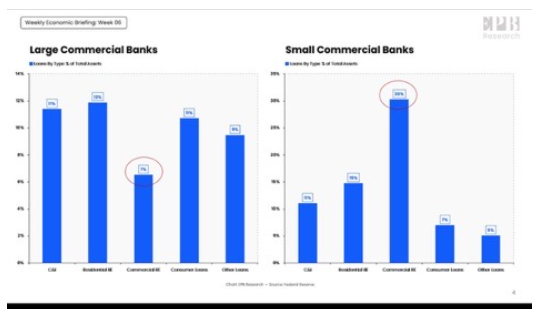
Commercial Real estate is about 7% of the large banks’ assets, and 30% of small banks’ assets. It’s certainly a problem that will be around for years to come, but it is unlikely to be the end of our strong GDP growth.
The Fed
The markets overshot the fed in terms of rate cut expectations, but regardless, at least 3 rate cuts are expected for 2024. Whether they kick off in spring or summer is to be determined. More importantly, there may be indications of QT ending at some point in 2024, which was very correlated to the most recent bitcoin price run up in the last week.
Market Expectations
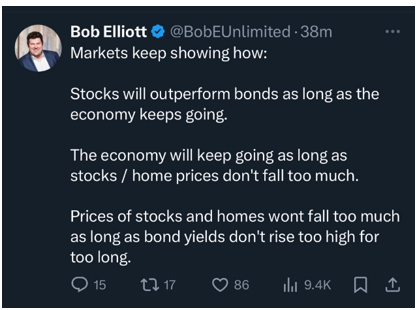
Increased debt increases uncertainty. Our government’s balance sheet is not something to overlook, but economic growth is currently robust in the US. It is very much a self-fulfilling prophecy where increased asset prices hold off decisions of layoffs, which keeps consumption strong. It is very much a glass house. Tidal’s very own Bob Elliot of Unlimited summed it up well; If we all stay calm, cool, and collected, the Qs will keep marching on. But if yields spike all bets are off. As we noted in our past commentaries, the only thing that can stop the Magnificent 6 is some sort of government intervention.
Volatility from elections may enter the market at some point this year. Equities will likely still outperform bonds, but not at the pace we’ve seen this year. If layoffs continue across the economy all of this can change at a moment’s notice, as the Fed is leaning populist and may prioritize employment over inflation in the short-term.
US Equities
The robustness of this economic cycle has surpassed expectations and continues to be stronger than most anticipated. This was also noted in the first sentence of our previous commentary. Real GDP advanced at an annual pace of 3.3% in the 4th quarter. iShares Core S&P Total US Stock Mkt ETF (ITOT) was up 26.1% in 2023, with 12.15% in Q4. It was up 1.1% in January and is up further in February. iShares Russell 2000 ETF (IWM) entered Q4 negative for the year but climbed 17.6% in Q4 alone to finish the year up 16.8%. It backpedaled -3.9% in January but is finally showing some upside to the mega caps in the last year, and growth outperformed value by 7.7%. Invesco QQQ Trust (QQQ) was up a blistering 54.76% last year with 19.11% coming in Q4. It was up 1.84% in January and is off to the races here in February.
Overall equity markets are likely ahead of themselves, but finding a strategy that will rebalance some of the irrational movements within the fund may be an ideal solution. Dare we say the return to a stock pickers market after a dominant 18 months from the Qs? Earnings growth is expected to expand to the rest of the market.
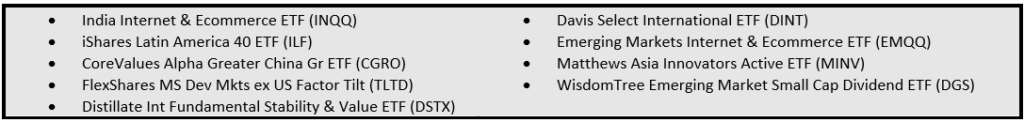
International Developed and Emerging Market Equity
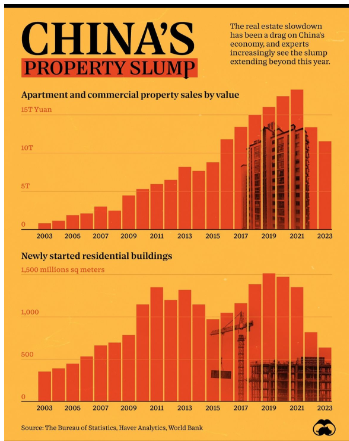
The iShares MSCI EAFE ETF (EFA) returned 18.07% for 2023, 13.8% in Q4. International markets are off to a bad start in 2024 with much weaker growth prospects in Europe. Growth numbers are a fraction of what we are experiencing here, but this ultimately will allow them to facilitate rate cuts more easily than here in the US. The iShares MSCI Emerging Markets ETF (EEM) returned -8.9% for 2023, as China’s economy faces further complications with the collapse of their largest real estate developer, Evergrande. Just like we’ve learned in the US, the market and the economy are not the same, and while China’s economy may not be great, its markets have been decimated. India and South America continue to provide opportunity, as do China’s tech market, and value hunting in Europe.
Fixed Income
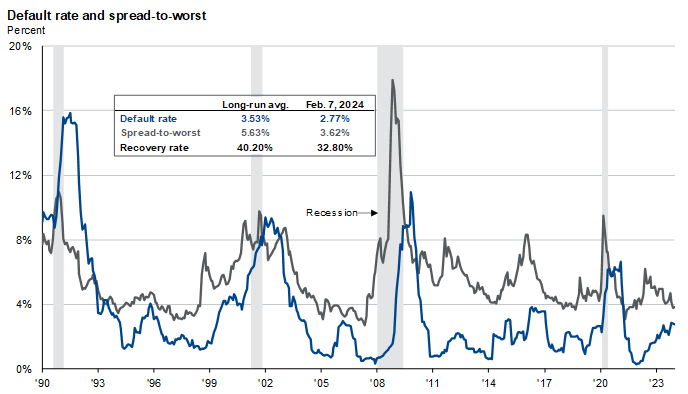
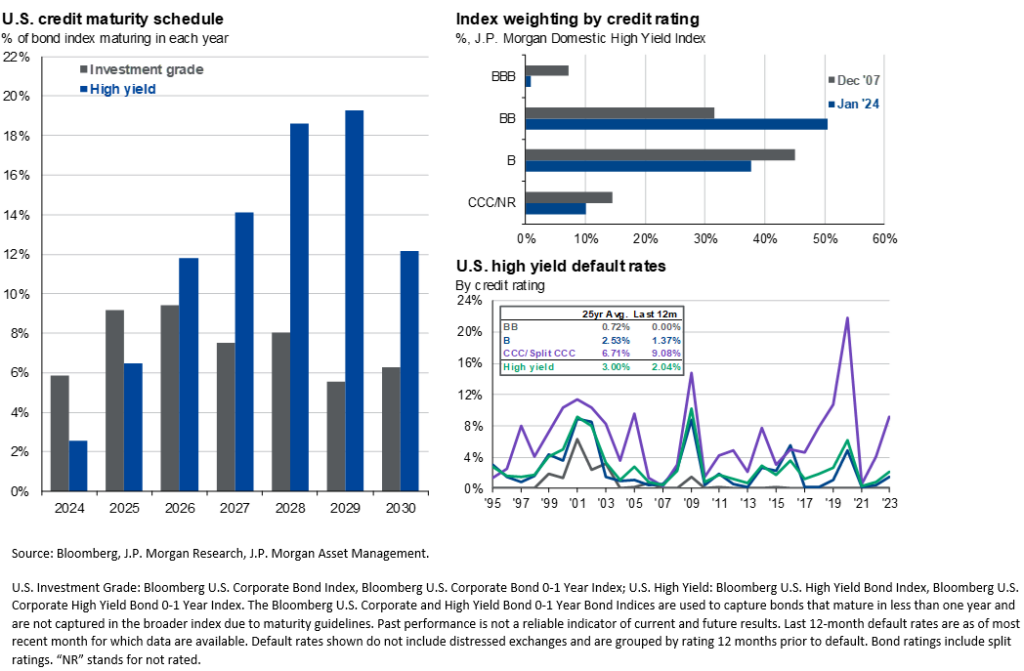
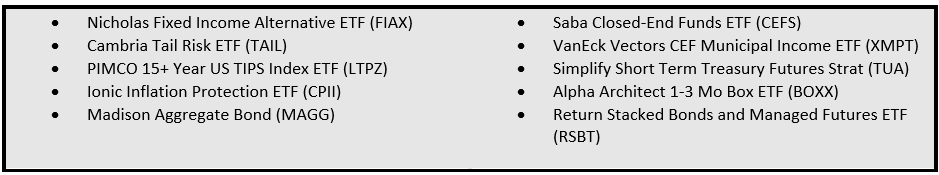
The 800+ day drawdown on duration ended with QRA 4. Debt issuance has picked up a bit in 2024, but in general has been artificially low with less supply. When companies continue to let future debt obligations pile up to avoid taking out a loan in this environment, a massive wall of credit maturity scheduled for the next few years builds up. iShares Core US Aggregate Bond ETF (AGG) went into Q4 negative for the year but rallied 6.69% in the quarter to finish the year positive 5.59%. Credit spreads are exceptionally tight. Finding nontraditional sources of yield, such as in the closed end fund space, can be helpful. Long term municipal spreads are also exceptionally. wide.
Alternatives
In 2023, the dollar gained 3.6%, giving back a bit in Q4, before picking up steam in 2024. 2024’s rally is tied to the strength of the US economy relative to other countries. In the face of increased yields in 2024, a strengthening dollar is impressive. Gold was up 13.68% in 2023. The same goes for bitcoin, which had an impressive 2023 and an exciting start to 2024, which unwound a bit with outflows in GBTC post-ETF conversion. Those have dissipated. The Federal Reserve discussing the eventual end of QT and the halving in April are heating things back up in crypto land.
A hypothetical high-active-share reconstruction of a traditional 60/40:
• 5% Yieldmax Magnificent 7 Option Income (YMAG)
• 5% R2000 Enhanced Options Income (IWMY)
• 5% Blackstone Strategic Credit 2027 Term (BGB)
• 5% Blackstone Senior Floating Rate 2027 Term (BSL)
• 3.5% Nicholas Fixed Income Alternative ETF (FIAX)
• 5% Return Stacked Bonds and Managed Futures ETF (RSBT)
• 3% Alpha Architect 1-3 Mo Box ETF (BOXX)
• 5% Hashdex Bitcoin Futures ETF (DEFI)
• 5% Blueprint Chesapeake Multi-Asset Trend ETF (TFPN)
• 5% Saba Closed-End Funds ETF (CEFS)
• 2.5% AGFiQ US Market Neutral Anti-Beta Fund (BTAL)
• 2.5% Ionic Inflation Protection ETF (CPII)
• 2.5% WisdomTree Enhanced Commodity Strategy Fund (GCC)
• 2.5% Tecrium Agricultural Strategy No K-1 ETF (TILL)
• 4% SPDR Gold MiniShares Trust (GLDM)
• 3% Mathews Asia Innovators Active (MINV)
• 3% iShares Latin America 40 ETF (ILF)
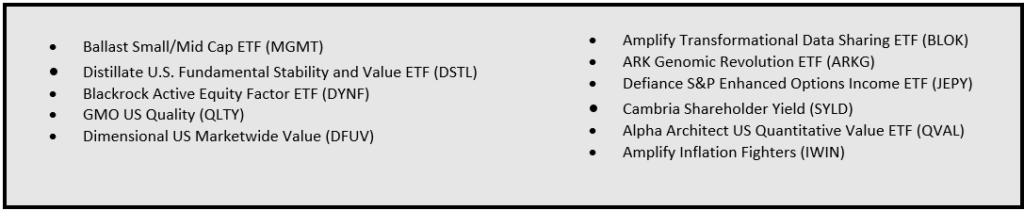
• 3% Amplify Inflation Fighters ETF (IWIN)
• 3% Amplify Transformational Data Sharing ETF (BLOK)
• 4% Ark Genomic Revolution ETF (ARKG)
• 4% Emerging Markets Internet & Ecommerce ETF (EMQQ)
• 4% Ballast Small/Mid Cap ETF (MGMT)
• 4% ETF 6 Meridian Small Cap Equity ETF (SIXS)
• 4% Alpha Architect US Quantitative Value ETF (QVAL)
• 5% Cambria Shareholder Yield ETF (SYLD)
• 5% Distillate International Fundamental Stability Value ETF (DSTX)
• 2.5% Distillate US Fundamental Stability & Value ETF (DSTL)
• 5% Madison Aggregate Bond (MAGG)
Read the full commentary here.
Disclosures
All investments involve risk, including possible loss of principal.
The material provided here is for informational purposes only and should not be considered an individualized recommendation or personalized investment advice. The investment strategies mentioned here may not be suitable for everyone. Each investor needs to review an investment strategy for his or her own particular situation before making any investment decision.
All expressions of opinion are subject to change without notice in reaction to shifting market conditions. Data contained herein from third-party providers is obtained from what are considered reliable sources. However, its accuracy, completeness, or reliability cannot be guaranteed.
Examples provided are for illustrative purposes only and not intended to be reflective of results you can expect to achieve.
The value of investments and the income from them can go down as well as up and investors may not get back the amounts originally invested, and can be affected by changes in interest rates, exchange rates, general market conditions, political, social, and economic developments, and other variable factors. Investment involves risks including but not limited to, possible delays in payments and loss of income or capital. Neither Tidal nor any of its affiliates guarantees any rate of return or the return of capital invested. This commentary material is available for informational purposes only and nothing herein constitutes an offer to sell or a solicitation of an offer to buy any security and nothing herein should be construed as such. All investment strategies and investments involve risk of loss, including the possible loss of all amounts invested, and nothing herein should be construed as a guarantee of any specific outcome or profit. While we have gathered the information presented herein from sources that we believe to be reliable, we cannot guarantee the accuracy or completeness of the information presented and the information presented should not be relied upon as such. Any opinions expressed herein are our opinions and are current only as of the date of distribution, and are subject to change without notice. We disclaim any obligation to provide revised opinions in the event of changed circumstances.
The information in this material is confidential and proprietary and may not be used other than by the intended user. Neither Tidal nor its affiliates or any of their officers or employees of Tidal accepts any liability whatsoever for any loss arising from any use of this material or its contents. This material may not be reproduced, distributed, or published without prior written permission from Tidal. Distribution of this material may be restricted in certain jurisdictions. Any persons coming into possession of this material should seek advice for details of and observe such restrictions (if any).