Week of March 20, 2023 KPI Summary
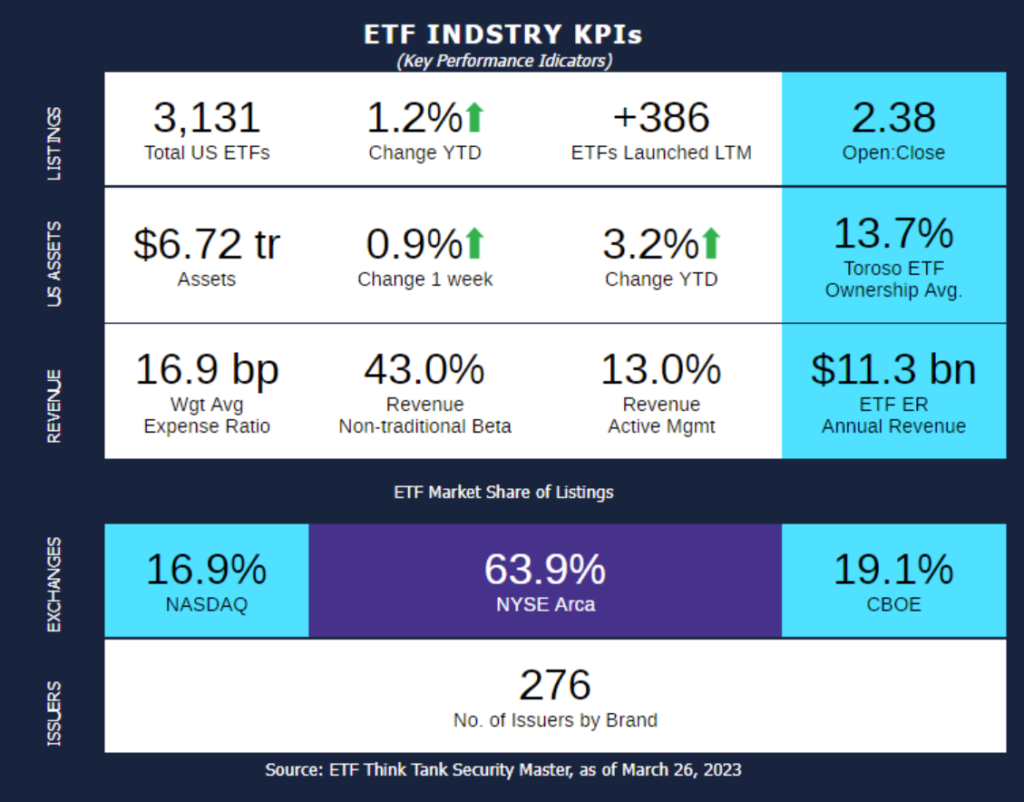
- This week, the industry experienced 8 ETF launches and 1 closure, shifting the 1-year Open-to-Close ratio to 2.38 and total US ETFs to 3,131.
- This past week was a mild one for the ETF industry with 0.9% change in assets and a small uptick in the amount of total funds. Meanwhile, for the American sport’s fans, the Men’s NCAA basketball tournament known as March Madness has certainly lived up to its name. For the first time, no “#1 seeds” made the Elite 8 and for the first time no 1, 2, or 3 seeds are present in the Final 4, which will be taking place this upcoming weekend.
- For a fun comparison, let’s compare the basketball teams remaining using their NCAA ranking to the top ETF issuers by AUM and see if you can predict the March Madness winner!
- UConn (11) is the top ranked team remaining, and their comparison, the #11 Issuer by Assets, is VanEck with approximately $55.3 Billion and 68 funds.
- Miami University (14) will be taking on UConn on Saturday. The #14 Issuer is Goldman Sachs with $28.1 Billion and 33 funds. Though smaller, Goldman’s average weighted expense ratio is 15.8 compared to 52.3 for VanEck.
- On the other side of the bracket, San Diego State (20) is compared to #20 Xtrackers with $19.0 Billion and 38 funds.
- Its competitor will be this year’s major underdog, Florida Atlantic University (27) which is represented by Capital Group with $7.7 Billion in only 9 funds. Though smaller, the AUM per fund is much higher than Xtrackers.
- Let’s see which representative from our ETF Industry can win it all – Let us know your predictions!
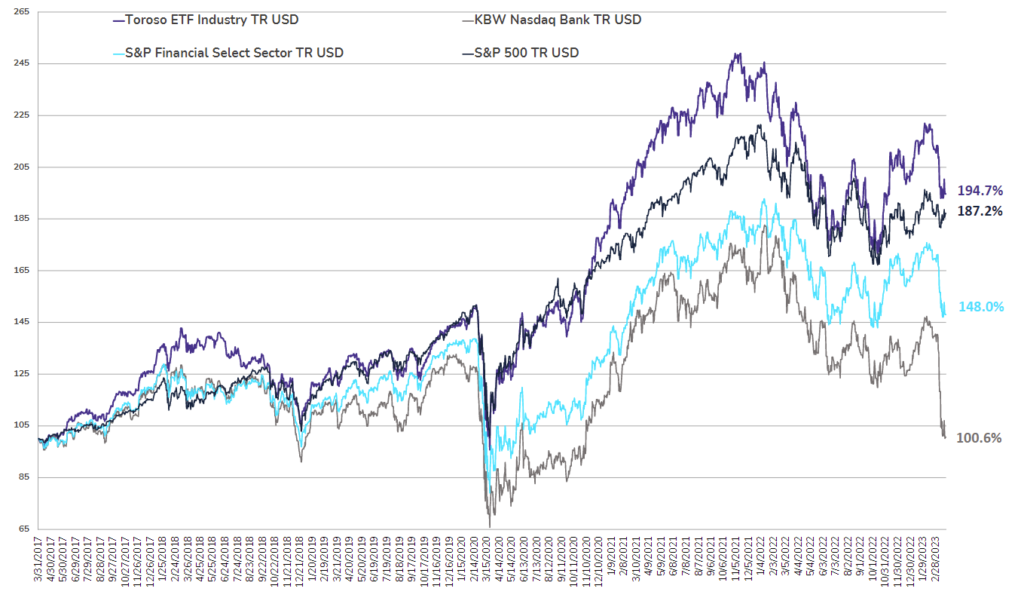
- The highlighted indexes experienced similar performance last week. The Toroso ETF Industry Index was up 0.80% while the S&P Financial Select Sector Index trailed at 0.58%.
ETF Launches
FT Cboe Vest U.S. Equity Enhance & Moderate Buffer ETF – March (ticker: XMAR)
FT Cboe Vest U.S. Equity Moderate Buffer ETF – March (ticker: GMAR)
Bitwise Bitcoin Strategy Optimum Yield ETF (ticker: BITC)
Roundhill Big Bank ETF (ticker: BIGB)
AB Disruptors ETF (ticker: FWD)
AB US High Dividend ETF (ticker: HIDV)
AB US Low Volatility Equity ETF (ticker: LOWV)
Sprott Nickel Miners ETF (ticker: NIKL)
ETF Closures
Gen Z ETF (ticker: ZGEN)
Fund/Ticker Changes
Mohr Sector Navigator (ticker: ENAV)
became Mohr Sector Nav ETF (ticker: SNAV)
TETF.Index Performance vs. S&P Financial Select Sector Index
(as of March 24, 2023)

TETF.Index Performance vs. Other Leading Financial Indices
(March 31, 2017 through March 24, 2023)
Why Follow the ETF Industry KPIs
The team at Toroso Investments began tracking the ETF Industry Key Performance Indicators (KPI’s) in the early 2000’s and have been consistently reporting on, and analyzing these metrics ever since. The table above was the impetus for the creation of the TETF.Index, the index that tracks the ETF industry. Each week, we will share the statistics we believe to be the most useful for identifying industry trends, in addition to the performance of the TEFT.Index.
DISCLAIMER
Past performance is no guarantee of future returns. This article is for informational and educational purposes only; is not intended to constitute legal, tax, accounting or investment advice; and does not constitute an offer to sell or a solicitation of an offer to buy any security or service. Furthermore, the Indexes shown above are not investable. While Toroso has gathered the information presented from sources that it believes to be reliable, Toroso cannot guarantee the accuracy or completeness of the information presented and the information presented should not be relied upon as such. Any opinions expressed are Toroso’s opinions and do not reflect the opinions of any affiliates or related persons. All opinions are current only as of the date of initial publication and are subject to change without notice. All investment strategies and investments involve risk of loss, including the possible loss of all amounts invested.


