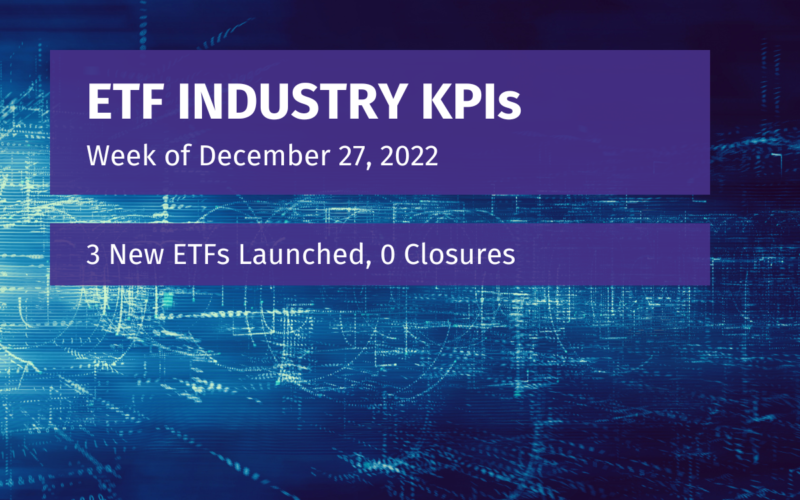
Week of December 27, 2022 KPI Summary
 Ryan Fitzgerald
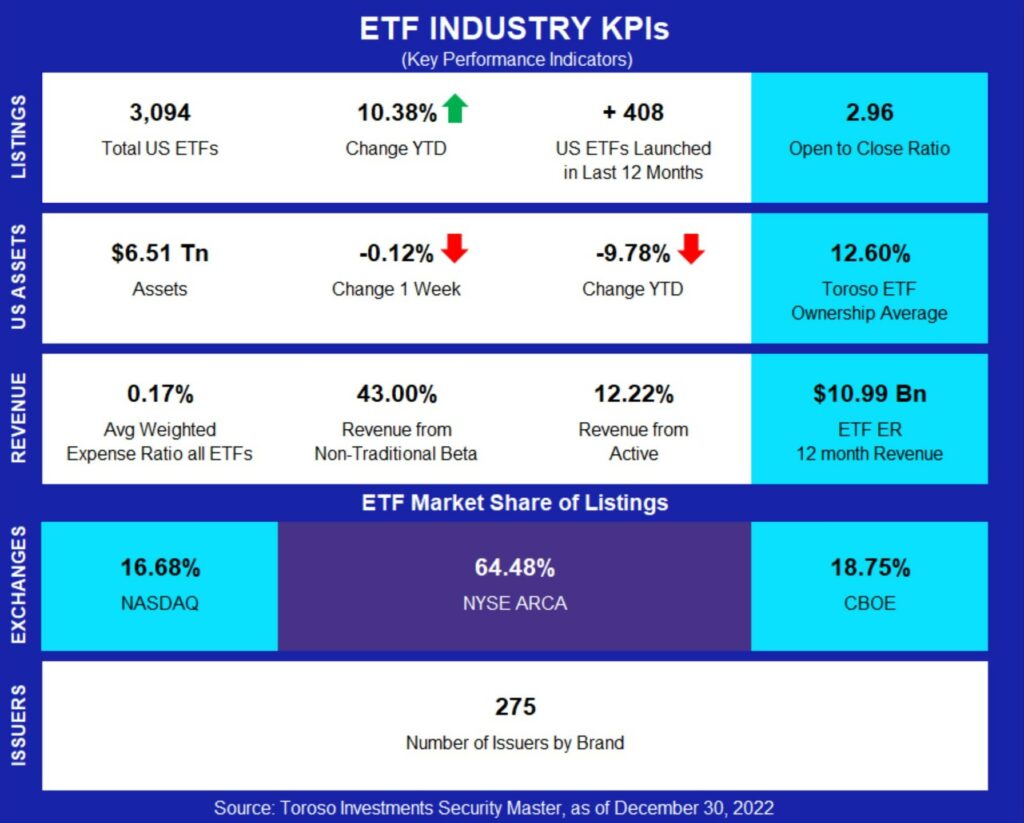
- This week, the industry experienced 3 ETF launches and no closures, shifting the 1-year Open-to-Close ratio to 2.96 and total US ETFs to 3,094.
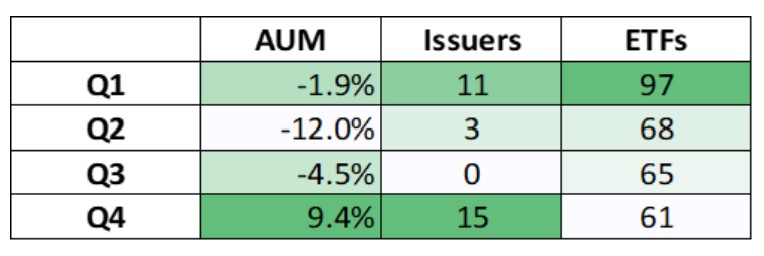
- Happy New Year to all our loyal ETF Think Tank members! For the first KPI update of the year, let’s take a look at how the 4th Quarter capped off an eventful 2022 (data comparing 10/2/2022 to 12/31/2022):
- Total assets increased 9.4%, there was an increase of 61 ETFs to total US ETF count (3,094), and +15 additional issuers by brand.
- From our 11 asset class categories, Options increased the most (12.9%) with Allocation in second (10.8%). Volatility had the worst performance (-26.6%) with Currency next (-15.7%). The two largest asset classes of Equity (76.08% of assets) and Fixed Income (19.29%) surged 10.5% and inched up 6.7% respectively.
- ETF expense ratio 12-month revenue grew from $10.06 Bn to $10.99 Bn.
- The revenue from Active ETFs dipped slightly from 12.30% to 12.22%.
- As the chart below suggests, Q4 for 2022 was a great one. It was the only period with a positive change in assets, the largest increase in issuers by brand, and a nearly average growth in the number of ETFs. Next week, we’ll take a deeper dive into 2022 as a whole.
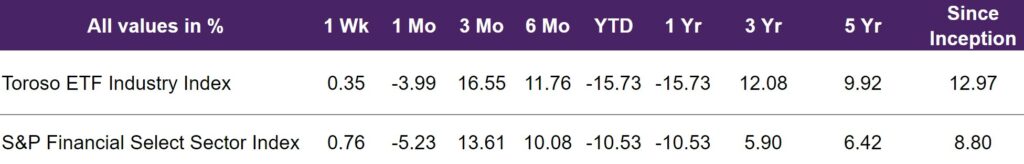
- The tracked indexes had similar positive experiences in Q4 2022. The Toroso ETF Industry Index was up 16.55% while the S&P Financial Select Sector Index trailed at 13.61%.
ETF Launches
Alpha Architect 1-3 Month Box ETF (ticker: BOXX)
Pinnacle Focused Opportunities ETF (ticker: FCUS)
Element EV & Solar Battery Materials (Lithium, Nickel, Copper, Cobalt) Futures ETF (ticker: CHRG)
ETF Closures
None
Fund/Ticker Changes
None
TETF.Index Performance vs. S&P Financial Select Sector Index
(as of December 30, 2022)
TETF.Index Performance vs. Other Leading Financial Indices
(March 31, 2017 through December 30, 2022)
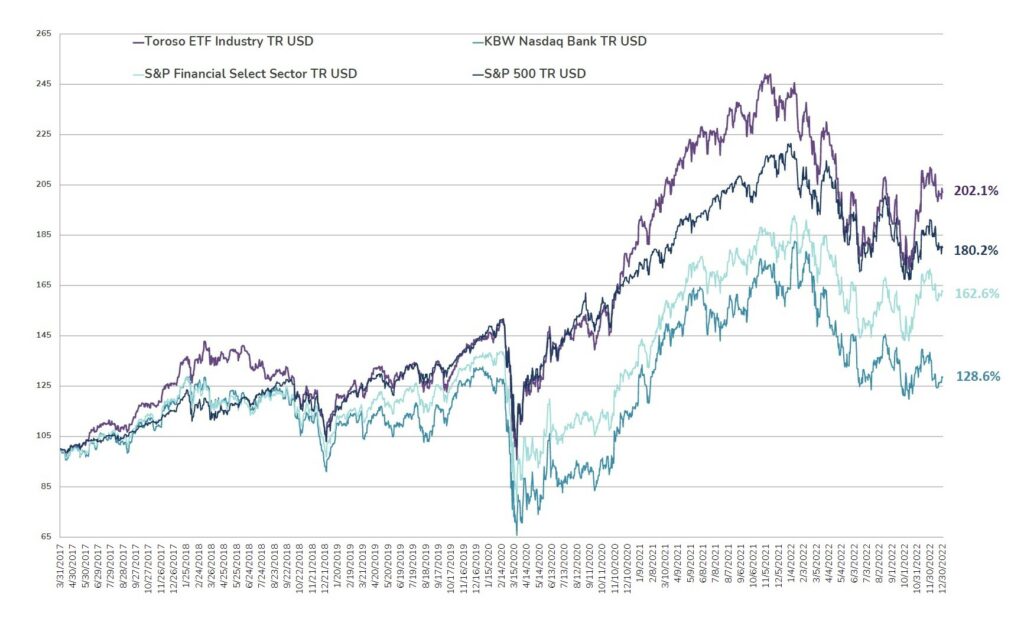
Source: Morningstar Direct
Why Follow the ETF Industry KPIs
The team at Toroso Investments began tracking the ETF Industry Key Performance Indicators (KPI’s) in the early 2000’s and have been consistently reporting on, and analyzing these metrics ever since. The table above was the impetus for the creation of the TETF.Index, the index that tracks the ETF industry. Each week, we will share the statistics we believe to be the most useful for identifying industry trends, in addition to the performance of the TEFT.Index.
DISCLAIMER
Past performance is no guarantee of future returns. This article is for informational and educational purposes only; is not intended to constitute legal, tax, accounting or investment advice; and does not constitute an offer to sell or a solicitation of an offer to buy any security or service. Furthermore, the Indexes shown above are not investable. While Toroso has gathered the information presented from sources that it believes to be reliable, Toroso cannot guarantee the accuracy or completeness of the information presented and the information presented should not be relied upon as such. Any opinions expressed are Toroso’s opinions and do not reflect the opinions of any affiliates or related persons. All opinions are current only as of the date of initial publication and are subject to change without notice. All investment strategies and investments involve risk of loss, including the possible loss of all amounts invested.