ETF Think Tank tracks ETF asset growth at about a 19% annualized rate due to two primary factors:
1. Client Alignment Growth Factors (Low Cost, Tax Efficiency, Transparency and Liquidity)
2. Innovation Growth Factors (Access, Alpha Generation and Active Implementation)
In this paper, we review which factors are likely to drive future ETF growth by evaluating how the growth-driving factors have evolved in the past decade.For many investors, the client alignment growth factor of low cost is seen as the primary driver of ETF asset growth. However, in this paper, using December 31, 2019 year-end data, we look back at the Top 20 ETFs launched every year in the past decade, measured by current assets under management (AUM. We categorized them between Low Cost Solutions (LCS) and innovation growth factors.1 The data illuminates a clear trend that innovation growth factors, like access, alpha generation and actively managed, are now becoming key to the future success of the ETF industry. Most importantly, the data highlights a new key performance indicator (KPI) called the “Annual Client Alignment to Innovation (ACAI).” No, it is not a super fruit, but rather a measure of the 20 most successful ETFs launched each calendar year. ACAI compares the ratio of launches and AUM from client alignment factors, like low cost, to innovation factors like alpha generation.
In many ways, this is the essence of the meaning behind the utility value of the label Smart Beta, or, what we refer to in the ETF Think Tank, Non-Traditional ETFs. Developing the proper nomenclature to describe innovation in Non-Traditional or Smart Beta ETFs requires consistency of definitions. To that point, and for purposes of this study, we have used the acronym AAA: Access (first to provide), Alpha Generation and Active, as a catch all for ETFs that have succeeded through innovation. From an investor’s stand point, we think of the use of Smart Beta as a “smart bet on AAA”. These are the three elements that define the utility value for an ETF investor who cares to seek value through security selection rather than low-cost, broad market exposure. For purposes of measuring innovation, we argue that active vs. systematic rules are not different for the investor’s purposes, because the utility value is simply the access. The trend is clear – although liquidity and low-cost factors drove the first wave of ETF success from 1995 to 2009, innovation has been a greater driver of success for ETFs launched in the past decade.

Defining the Data Set
By measuring the yearly progress of innovation using ACAI as the KPI that tracks ETF innovation, both  in terms of numbers and AUM relative to low cost, investors begin to see how the ETF market is expanding and innovating. To be clear, the terms ACAI Number and ACAI AUM are used to illustrate the ratios. AAA and Innovation Growth Factors are used interchangeably.
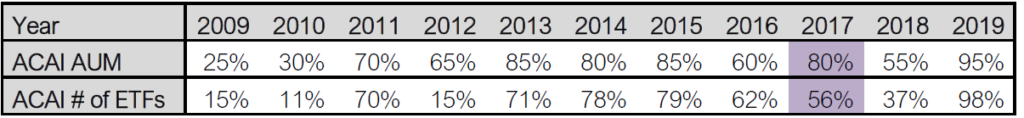
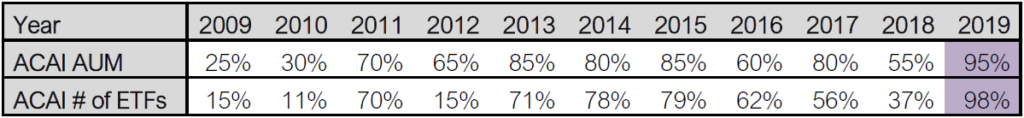
For the purpose of this paper, we focus on traditional, broad market weighted ETFs with low active-share, that provide reduced cost access similar to existing products deemed as strictly LCS. Given the evolution of competing strictly on expense ratio, we can expect that the ACAI ratios will consistently increase with market dynamics, thereby highlighting how innovation is developing in a dynamic manner. For example, 2019 ACAI report data shows that 94% of the launches in the Top 20 are defined by one of the 3 growth factors. Additionally, we can see that the ACAI AUM has risen from 14.8% to 98.5% over the past 11 years. Moreover, the number of ETFs launched specifically to compete on low price (expense ratio) has declined in numbers in the past few years due to the need for quick scale. As a result, the number of ETFs in the Top 20 offering differentiation through innovation or AAA has steadily increased – and so has the percentage of AUM going into this category. The fact is that AAA ETFs are in fashion because certain investors have a need to manage risk, seek access, and/or target active share. The chart below shows how the assets associated with innovation have increased 6-fold between 2009 and 2019. This is an important trend because it is the beginning of large institutions embracing the value of an ETF as simply an efficient investment delivery tool that serves the needs of their beneficiaries.

It should be expected that, at the end of 2020, some of the Top 20 Innovator ETFs in 2019 ACAI will change. The study is not designed to identify which ETF will be successful, but rather to measure the evolution of ETF innovation. This is important to ETF Think Tank members, as provides a report card for how the industry is adapting to market dynamics.
Key Definitions
The ACAI measure of the Top 20 new ETFs at the end of 2019 suggests that ETF innovation is accelerating. ACAI can be measured across each year and by a trailing 5-year period. ACAI can be a percentage measure of the absolute number, as well as the AUM. For example, ACAI 2013 provides the AAA/Low Cost on 2013 as $287,939 billion divided by $627,640 billion. In the ETF Think Tank, we embrace the dynamic nature of investment markets and value security selection as an essential component of investing, so innovation is a critical solution to potentially managing risk as well as alpha.

 According to the ETF Think Tank databases as of December 31, 2019, the Top 220 ETFs launched between January 1, 2009 and December 31, 2019 have $414 billion in AUM across 146 access and alpha targeted ETFs, compared to $688 billion in AUM across 74 low cost broad ETFs. This means that 33%, or 74, of the Top 220 ETFs were focused on providing low cost. In different terms, assets invested across 220 ETFs, worth about $1.3 trillion at the end of 2019, were split, 53% towards LCS as a value proposition, and 47% across AAA as Active/Access ETFs targeted at Alpha. Headlines may focus on low cost broad market access, but the following evidence shows that the a in SMART BETa defined as active, access or alpha, is thriving. Bottom line, the success of these 146 Top 220 ETFs with $414 billion in AUM were identified by discerning investors seeking differentiation and choice rather than homogeneous low cost. Moreover, there is an ETF market trend forming, showing that ETFs defined by AAA are gaining momentum.
Over the past 11 years, ETF AUM have grown from $777 billion to $4.420 trillion. This paper serves to present new data about how investors are embracing the ETF wrapper as an integral delivery mechanism for accessing innovation. There is no question that flows into low cost ETFs have dominated headlines and investor mindshare. However, data skewed by survivor bias and first mover advantage show that innovative investor solutions wrapped in an ETF are being accepted, and even showing signs of acceleration. Specifically, the percentage of Top 20 LCS went from 36% in 2009-2013 down to 24% in 2014-2019. Their AUM percentages went down as well, from 68.55% in 2009-2013 to 32.55% in 2014-2019.Conversely, the cumulative number of ETFs launched and their percentage of the AUM both almost doubled in terms of degree of change. The percentage of cumulative AAA solutions AUM increased from 31.45% to 67.45% and the percentage of ETFs in the Top 20 increased from 46.67% to almost 75.83%. This is the reason the ACAI ratio increased.
The Top 20 largest ETFs represent nearly 40% of the AUM in the US ETF market, and the Top 100 represent about 70% of the AUM. However, in terms of revenues within the industry, actively managed ETFs recently eclipsed 6% of the total ETF 12-month Projected Revenues, despite only representing 2.22% of the AUM.
Four Points on this Trend
- Due to the recent success of many of the original traditional low-cost ETFs, innovation ETFs represent a declining percentage of AUM overall. The yellow highlights how new launches are having less of an impact in the amount of dollars invested. This is a function of large numbers and evident liquidity from established ETFs. It is also probably a function of time, as it takes years to build a track record. Nevertheless, the $11.439 billion value of what was launched in 2019 was only about .26% of the overall AUM ($4,420 trillion). Note that this number increases progressively as time passes. In 2014 and 2015, the number is in the range of 3.6%. Performance records take time.
- The highlighted green reports on what total percentage is cumulatively represented by new launches during the 2009-2019 period. Most AUM remains in launches prior to 2009, but as noted later in the section regarding 2014, there may be periods of time where launches explode and shrink according to demand. Specifically, this refers to Currency Hedge ETFs. At the end of 2019, the 30% number is represented by $1.3 trillion divided by $4.4 trillion. This number may continue to recede, and reflects the fact that most of the denominator is in traditional passive ETFs which solve for low cost client alignment factors.
- The blue highlights are designed to simply show how the dollars have been flowing between low cost and AAA. Details can be found upon request for the back-up data that show the list of launches. What is important to highlight is the fact that in recent years, low cost broad ETF solutions have been successful only by firms with deep custodial relationships, and even those ETFs offer high active share over established broad benchmarks.
- The purple highlight simply provides the value of Top 20 ETFs to give context to the data.

Between January 2009 and December 31, 2019
- Low Cost Funds: Low cost ETFs launched between 2009 and year-end 2019 attracted $688 billion
 in AUM, which represents 53% of the total AUM and only 33.6% of the number of Top 20 ETFs. AUM raised was targeted as a broad LCS; it represented 16% of the overall ETF AUM, arguably proving that cost becomes an element of diminishing returns. Investors have not been aggressively switching from one low cost fund to another just to save 1-3 Bps on the fee; the real incentive comes from loss realization.
 - Alpha Funds: The Top 20 ETFs representing 108 in number were launched with the objective of delivering alpha instead of traditional solutions through active or rules-based non-traditional weighted markets (the traditional definition of “SmartBeta”). For these funds, success may not mean that they achieved their stated alpha objective. Success is rather defined by gathering $318 billion in AUM which at the close of December 31, 2019 represented 7.1% of the overall AUM market. Where outperformance is achieved it would be reasonable to expect that flows will follow. Again, however, performance track records are not earned overnight.
- Access Funds: An Access Fund is an ETF that is paving new ground for investors by offering access to markets previously unavailable in the ETF wrapper. Investors embracing these 38 funds are seeking to achieve alpha, targeted returns, strategic diversification, risk control or different types of fixed income. These funds represented $95 billion in AUM at the end of December 31, 2019 – only 2.2% of total AUM.
- Survivor Thriver Bias: Survivor bias refers to the choices still available versus ETFs that have been
 closed. As of December 31, 2019, 1,623 launches survived (worth $1.305 trillion), but 971 ETFs have AUM greater than $50 million and are therefore poised to thrive. This number excludes funds launched in prior years, ETFs that have closed, and even funds that have AUM below $50 million. The focus on Survivor Bias at the $50 million and above level is constructive, as it represents 99% of the Total AUM raised during this period, and now represents 29.2% of the total AUM in the ETF market. Keep in mind that 971 ETFs represent 42% of the 2,300 ETF choices that exist today. ETF closures are not reflected during this period, which may see bumps in the road.
 - Recent Launch Trend: The broad-based, low-cost ETF solutions launched in earlier years are crowded. 2009, 2010 and 2012 saw an influx of successful launches, but the bulk of the launches of late have been about access and alpha weightings. JP Morgan, which has a strong custodial relationship, is an exception. It can get to scale quickly by launching branded solutions. From 2013 to 2019, the bulk of the surviving launches have been focused on providing access and alpha targeted solutions. In 2019 the percentage of Top 20 ETFs was 94.7%.
As of December 31, 2019, ETF survivors are worth $1,305 trillion in terms of AUM. This means that what was launched in the 11-year period between 2009 and 2019 represents about 30% of the aggregate value of the US ETF market. Unsurprisingly, 74 of the 220 launches that are now in the Top 20 (in terms of AUM) simply compete on price. Vanguard and Schwab launched most of the 29 ETFs back in 2009 and 2010, proving three things: (1) The custodial relationship has a competitive advantage for AUM growth that can be offset in other ways to make money; (2) In a bull market, low price is what the majority of investors see as value; (3) Platform access and business scale for ETFs is becoming a meaningful hurdle.
Low cost ETF solutions also found launch success in 2012 and 2018. They represented 85% of the AUM launched in 2012 and 44.4% of the AUM launched in 2018. However, in this later period (2013-2019), most of the Top 20 AUM success is in ETFs that are providing targeted alpha or access through differentiation. Many of these ETFs are blurring the lines between active and “actively managed rules-based strategies,” but will probably be the focus of future launches, in both equities, fixed income, and alternative/asset allocation strategies.
To be clear, low cost beta launched in the past 11 years currently represent about 16% of the $4.420 billion in AUM and have probably not been drivers of ETF AUM growth. Arguably, investors looking for low cost broad access have plenty of similar choices, so these additions were mostly about custodial platform breadth or new ETF market entrants. ETFs such as SPDR S&P 500 (SPY) and Invesco QQQ Trust (QQQ), launched prior to 2009, would represent top 20 in their respective launch periods, and are about 36% of the total aggregate AUM. This is part of the reason why the asset-based fee has stayed steady at 19 Bps despite all the fee compression. The point is, in the coming decade, we think ETF differentiation will be recognized by investors either with a different message, like ESG, or because changes in market dynamics and risk budgeting will play a more important role.
The Coming Decade
Innovation of the Wrapper Will Drive New Listing Growth

Headlines by JP Morgan and Bank of America regarding ETF AUM reaching $30 Trillion or $50 trillion show why every fiduciary and financial institution needs an ETF strategy for their business. However, not every fiduciary is embracing the evolution the same way. It is clear that most of today’s fiduciaries use ETFs to gain broad market exposure and liquidity. However, in many cases, fiduciaries are also starting to look at ETFs as a solution for achieving alpha, differentiation and/or diversification. This is important because ETF fee compression means scale needs to be achieved quicker to see innovation thrive. It is for this reason that the BYOA trend will accelerate over the coming decade. Regardless of ETF wrapper deliverance, active management will also be an important trend to monitor. Certain strategies need to be managed in an active manner for structural reasons. In certain cases, there is a fine line between a strategy that is rules based (rebalanced quarterly) and a technically pure active strategy. However, in the future, high active share will continue to be an important metrics of differentiation when markets become more difficult. AUM growth in the ETF market will accelerate in the fixed income and liquid alternative spaces. Members of the ETF Think Tank have access to a set of proprietary tools that define Smart Cost, Concentration Risk and Active Share. However, due diligence is also about experience, opinions, and defining the opportunity set to meet the ideal client outcome. Members are also encouraged to share insights and experience through due diligence calls. Finally, most fiduciaries in the future will also need to build ETF business strategies that lead with a level of client centricity that is also scalable and adaptive.
ETF closures make headlines for the skeptics, but success and greater investor choices are where ETF Think Tank members focus their energies. Bringing an ETF to market comes with many challenges. An ETF is more than just a good idea, and even more than achieving historical positive outcomes, alpha or access. The fact is that ETF AUM growth over the next decade will have to focus more on fixed income and alternative strategies instead of traditional market cap LCS. This means that the “AAA” in SMART BETa will likely thrive even more. For example, in the way of fixed income, it is illogical and against mathematical credit rules for the traditional passive methodologies to work. The lender does not gain higher quality credit scores or greater cash flow from higher quality credit trading. Additionally, bigger in terms of market cap weightings is not always going to be better in the equity markets. The alternative category, allocation and hedge fund methodologies, is only about $14 billion in AUM and still in its nascent stage of development. Hedge funds tend to use ETFs as a trading vehicle. Over the next decade it would be logical for many to execute their strategies in ETFs to implement tax-efficient customized solutions for the benefit of their taxable clients. Ultimately, it is the after-tax return that impresses the investor the most. Other institutional investors, such as insurance companies, family offices and pension plans, will also target ETFs for the benefit of their individual constituencies.
Breaking Down 11 Years of Innovation from 2009 to 2019
Below are some quick observations about the past 11 years, which I have lived through. They may not have value in the context of the overall message of ACAI and the need to measure innovation, but as the @ETFProfessor, I couldn’t resist. My hope for the quick shares and observations is that others appreciate my experience and join the ETF Think Tank. In terms of ACAI innovation ratings, we recommend a 5 year rolling average (see below ACAI charts). Innovation data can be lumpy when measured in the context of Top 20 ETF. The full data set is available to financial professionals upon request to dweiskofp@torosoinv.com.

2009: Price Wars Survive the AUM Charge, but Fixed Income Proves the Access Innovator

In 2009, Vanguard and Schwab battled it out to offer low cost access to needed markets. However, 2009 also brought the launch of the WisdomTree Europe Hedged Equity Fund (HEDJ), which at one point had over $22 billion in AUM, and today only has about $3 billion. This launch broke new ground, following the success of WisdomTree’s 2006 launch of the WisdomTree Japan Hedged Equity Fund (DXJ). It is noteworthy that today DXJ, at $2 billion, wouldn’t even make the cut for the 2006 Top 20 Innovator ETFs (ACAI 2006). ACAI, remember, is an evolutionary way to measure the success of innovation. 2009 was also the access to the high yield MUNI market with the launch of VanEck Vectors High-Yield Municipal Index ETF (HYD).
Nevertheless, with 85% of the AUM now hosted in 15 of the Top 20 ETFs launched in 2009, it is clear that Vanguard and Schwab’s bold moves in 2009 paid off. Low cost and/or transparency in 2009 arguably would have been the most important growth driver. ETF growth in 2009 was also arguably accelerated by the transparency desire triggered by the Bernie Madoff fraud. Low cost broad solutions play to the strengths of these big brand custodial firms, and millions of investors have benefited from the savings. However, this was also the year that PIMCO used its brand with the launch of its first active ETF, the PIMCO Enhanced Short Maturity Active ETF (MINT).

2010: Vanguard Breaks the Bank with VOO

Most investors will not remember the controversy around the benefits proposed by the launch of the Alerian MLP ETF (AMLP) structure to compete against an established ETN product. Looking through the list of the 2010 Top 20 ETFs, it is clear that this was the year that firms with a custodial advantage, like Vanguard and Schwab, stepped on the price war peddle and broadened out their offerings. Again, following the success of 2009, by the end of 2019 these 14 ETFs had raised $180 billion, thereby representing 88% of the amount raised by ETFs launched that year.

2011: ETF Factor Investing Takes Center stage

iShares Blackrock launched BAMM! Low Vol and Minimum Vol ETFs with the promise of a smooth ride for investors who were looking to access the equity markets efficiently. Morningstar® Global Upstream Natural Resources Index Fund (GUNR) was launched by NorthernTrust as Flexshares after backpeddling from the ETF market a few years back.
While low cost ETF launches continue to attract inflows, factor investing excites investors. Almost 70% of the dollars allocated during 2011 now fall into the Access and Alpha categories, Meaning that in the year 2011 about $120 billion of the $172 billion is in 14 of the Top 20 ETFs.
2012: iShares Capitulated to Vanguard on Low Cost

There is some irony in the fact that on the list of Top 20 ETFs, VanEck Vectors Morningstar® Wide Moat ETF (MOAT) came the same year that iShares capitulated by launching a suite of lower priced ETFs to compete with Vanguard. ETF nerds will also remember that 2012 was the year MSCI stockholders woke up to the news about Vanguard’s decision to switch index providers to save money for their investors. 2012 also saw the launch of Global X’s copycat ETF in the MLP space (MLPA vs. AMLP).
Bottom line, in the absence of value, price matters. Therefore, Blackrock’s move in 2012 was necessary. Cannibalize yourself or be cannibalized by others. Evidence of this is clear in the fact that the Top 3 ETFs (iShares Core MSCI Emerging Markets ETF (IEMG), iShares Core MSCI EAFE ETF (IEFA) and iShares Core MSCI Total International Stock ETF (IXUS)) launched in 2012 represent 72% of the $215 billion of flows while AUMs in similar funds like iShares MSCI Emerging Markets ETF (EEM) and iShares MSCI EAFE ETF (EFA) have been cut in half. However, what has gone unnoticed is the fact that 13 of the Top 20 ETFs launched that year offer thoughtful indexes designed to provide Alpha.


2013: Schwab and ProShares Step Out of Their Comfort Zone

In 2013, certain issuers stepped out of their comfort zone and found success by being different than their core value proposition. Schwab, under the leadership of Tony Davidow, decided to launch a suite of fundamental ETFs and compete by offering different access points. 2013 also saw ProShares jump into the dividend space with the ProShares S&P 500 Dividend Aristocrats (NOBL). Nerds will point out that iShares Select Dividend ETF (DVY) was launched in 2003, and highlight that it still has AUM of $17 billion with a fee of 39 Bps.
Distribution and changes in platform access may have played a critical role in the success of many of the 2013 Top 20 ETFs. Evidence of this comes from the success of Vanguard Total International Bond ETF (BNDX) – the clear winner in terms of raising AUM ($24 billion) and performance. However, performance is not enough, as noted by the outperformance of the WisdomTree US Quality Dividend Growth Fund (DGRW), ProShares S&P500 Dividend Aristocrats (NOBL) and iShares Select Dividend ETF (DVY).


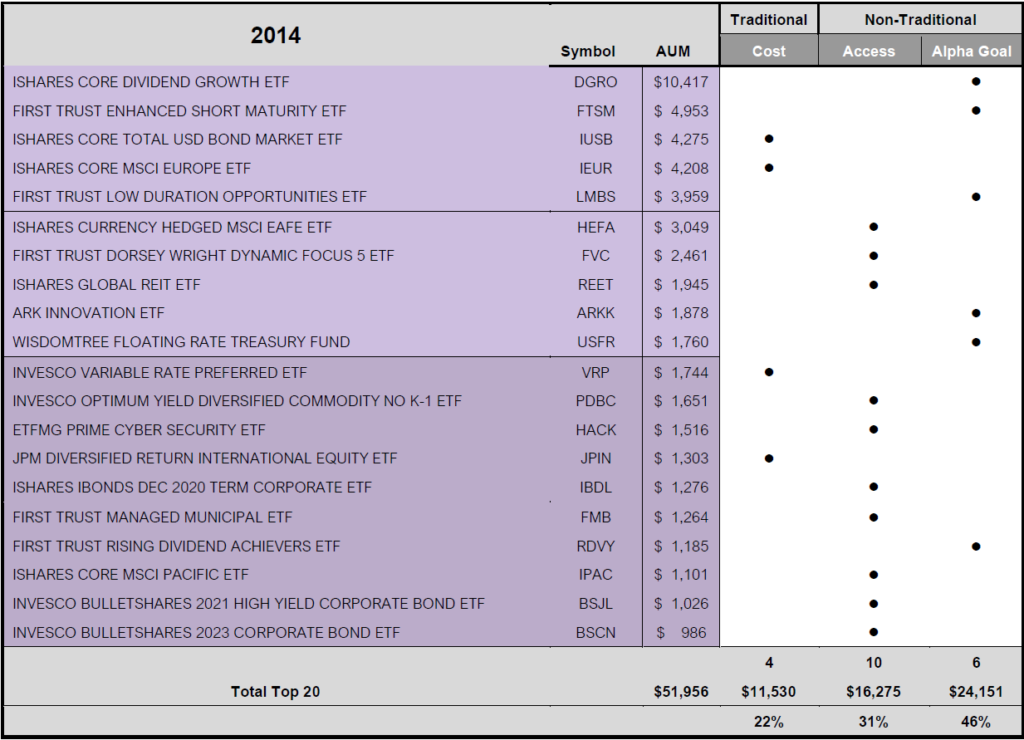
2014: Marketing Bonanza for ETFs… Sony was “HACKed, Bullets Fly and the ARK was Floated!

Blackrock launched the iShares Core Dividend Growth ETF (DGRO) in 2014, targeting both Alpha and low fee. While the fee is low at 8 Bps, the difference, as measured by “Active share”, is meaningful. This ETF could arguably check all 3 boxes, but given its overlap with other dividend strategies, it is characterized as an Alpha target.

In the way of fixed income, Guggenheim launched the BulletShares suite of fixed income ETFs in 2014. ETF marketing is tricky since regulators are careful about how a marketing message is aligned with a specific outcome. The promise of having monthly income tied to a targeted date, referred to as a “bullet,” proved ideal.
2014 was also the year Sony was exploded by a hack, and everyone on the globe realized that cyber security was a huge threat. Fortuitously, Andrew Chan and his crew had an ETF solution; ironically enough, its symbol was HACK (ETFMG Prime Cyber Security ETF).
ARK Investing, an actively managed suite of ETFs, came out swinging in 2014. For better or worse, Catherine Wood offered high-convictions thematic portfolios backed by evidenced-based research with complete confidence, which presented investors with end-of-day trade transparency in the form of email distribution.
In many ways, 2014 was a pivotal year for ETF marketing, through product, price and process. Most importantly, today, 16 of the Top 20 ETFs are successful because they provide differentiated access and/or the goal of targeted alpha.
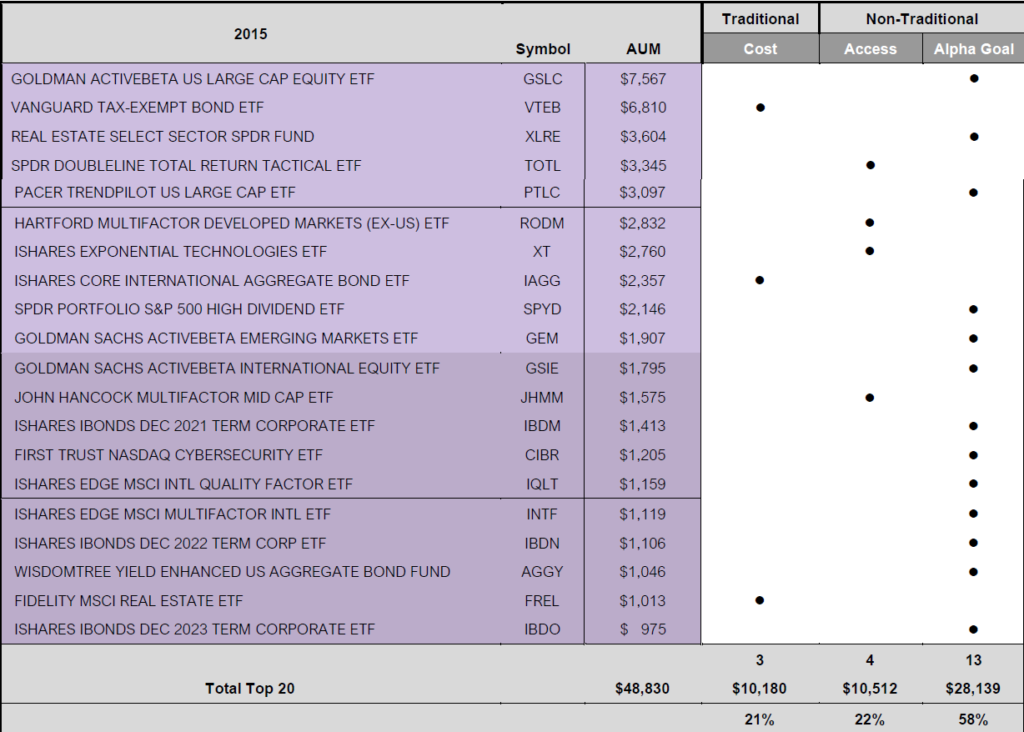
2015: Big Brands Like Goldman and Doubleline Break New Ground
In 2015, StateStreet and Doubleline’s Jeffrey Gundlach, the newly minted Bond King, collaborated, combining distribution muscle with active management. This followed StateStreet’s collaboration with Blackstone back in 2013 on launching an actively managed Senior Loan ETF (2014 PM Interview).
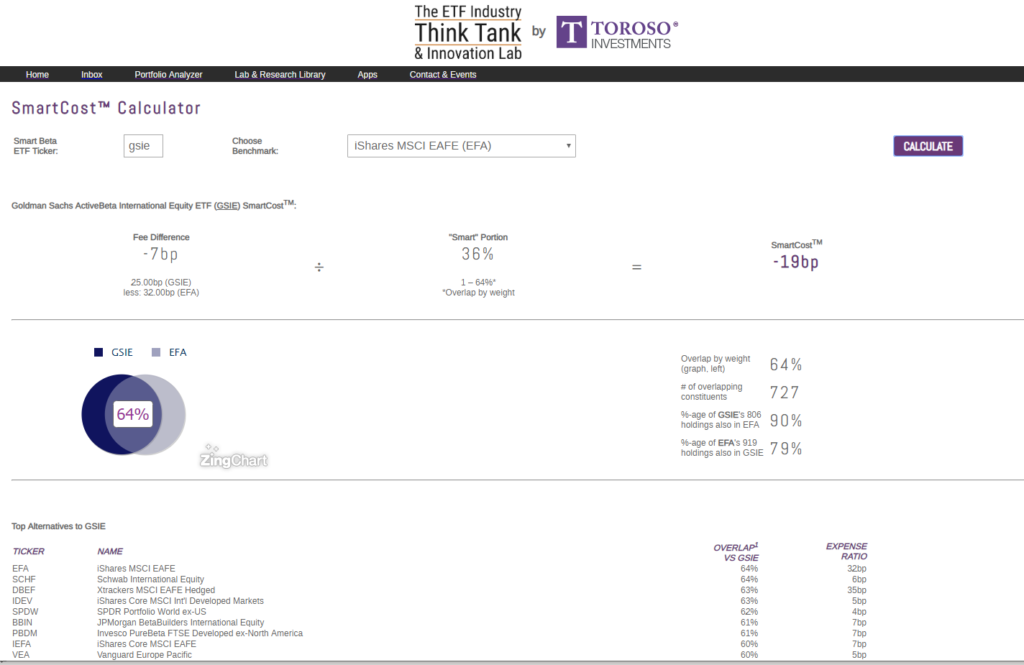
In 2015, Goldman Sachs launched a new suite of ETFs offering high active share and priced in line with the SPDR S&P 500 ETF (SPY), in the case of Goldman Sachs ActiveBeta US Large Cap Equity ETF (GSLC). Using the ETF Think Tank Smart Cost calculator™, we found out that today, the Goldman Sachs Active Beta ETF suite, including Goldman Sachs ActiveBeta International Equity ETF (GSIE) and Goldman Sachs ActiveBeta Emerging Markets Equity ETF (GEMS), screen a 72% to 60% overlap across the crowded broad category that is under pricing pressure. Flows have been driven by custodial relationships and good outperformance, but the real question is: when do investors need to invest in the international and emerging market equity markets?
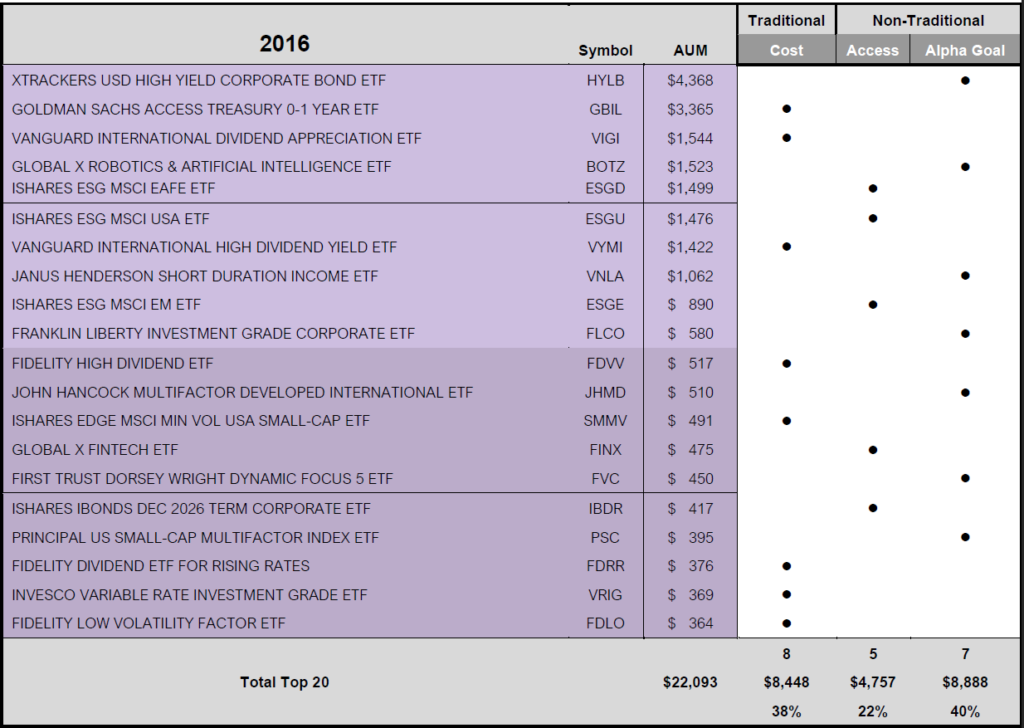
2016: A Diversified Group of Top 20 Survivors
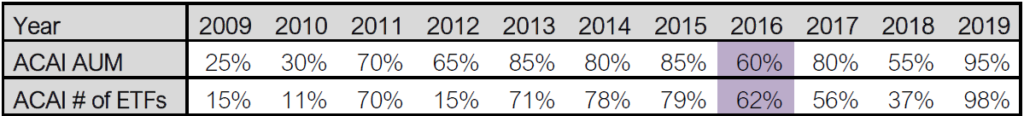
The Top 20 ETF survivors in 2016 show no key trends, and today only amount to $22 billion. High yield and ESG dominate the scene with Xtrackers USD High Yield Corporate Bond ETF (HYLB), iShares ESG MSCI EAFE ETF (ESGD), iShares ESG MSCI USA ETF (ESGU) and iShares ESG MSCI EM ETF (ESGE), but the ESG launches only appealed to early adopters. Many of the ETFs launched in 2016 were new entrants, with the Fidelity ETF offering rounding out. However, 12 out of the Top 20 new launches (representing $13.6 billion, or 62%, of the AUM) are providing new access and the expectation of alpha.
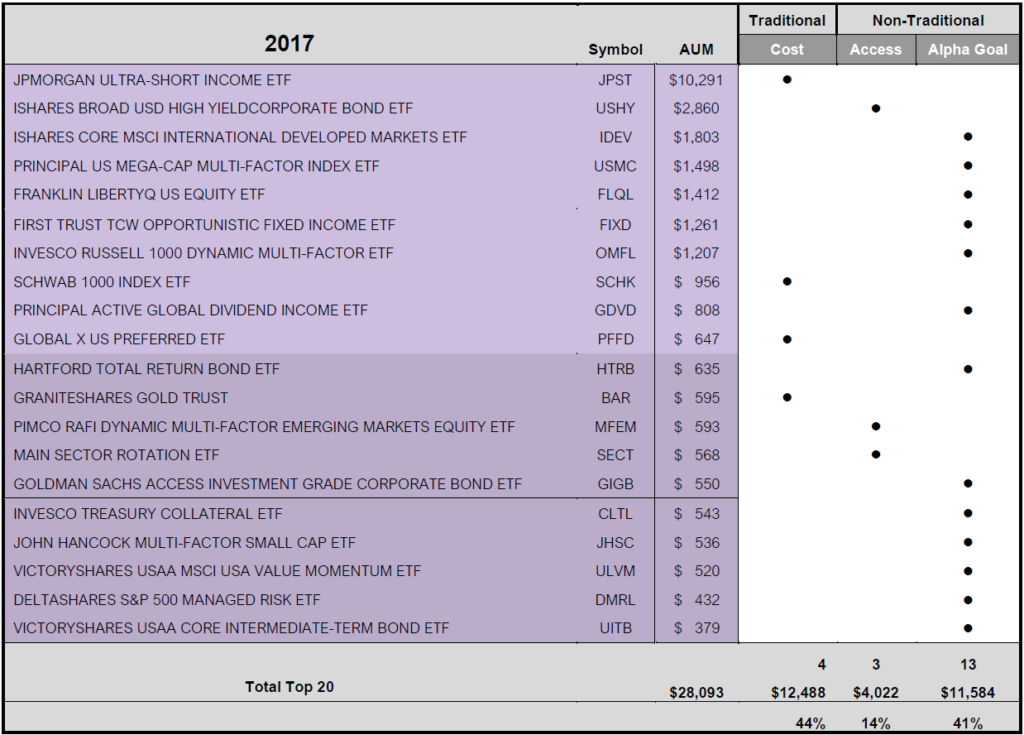
2017: Is There Victory for New Entrants?
In 2017, a year where the S&P 500 was up almost 22%, equities investors had the opportunity for victory. Coincidentally, 2017 is the same year that VictoryShares launched the VictoryShares USAA MSCI USA Value Momentum ETF (ULVM). Large new entrants in the ETF market at this point needed a clear advantage in terms of marketing, custodial relationships or the ability to deliver alpha, and especially equities. However, in 2017, GraniteShares was launched with the backing of Bain Capital. GraniteShares also brought the promise of disrupting the commodities ETF space by launching its commodities ETFs that had no K-1s, like GraniteShares Bloomberg Commodity Broad Strategy No K-1 ETF (COMB), and that would be competitively priced, like GraniteShares Gold Trust Shares (BAR). The message was: why pay more for access to the gold market?
The Top 20 ETF survivors in 2017 show no key trends and have raised $28 billion. However, it is important to remember that 16 out of the 20 new launches (representing $15.5 billion, or 55%, of the AUM) are providing new access, and the expectation of alpha.
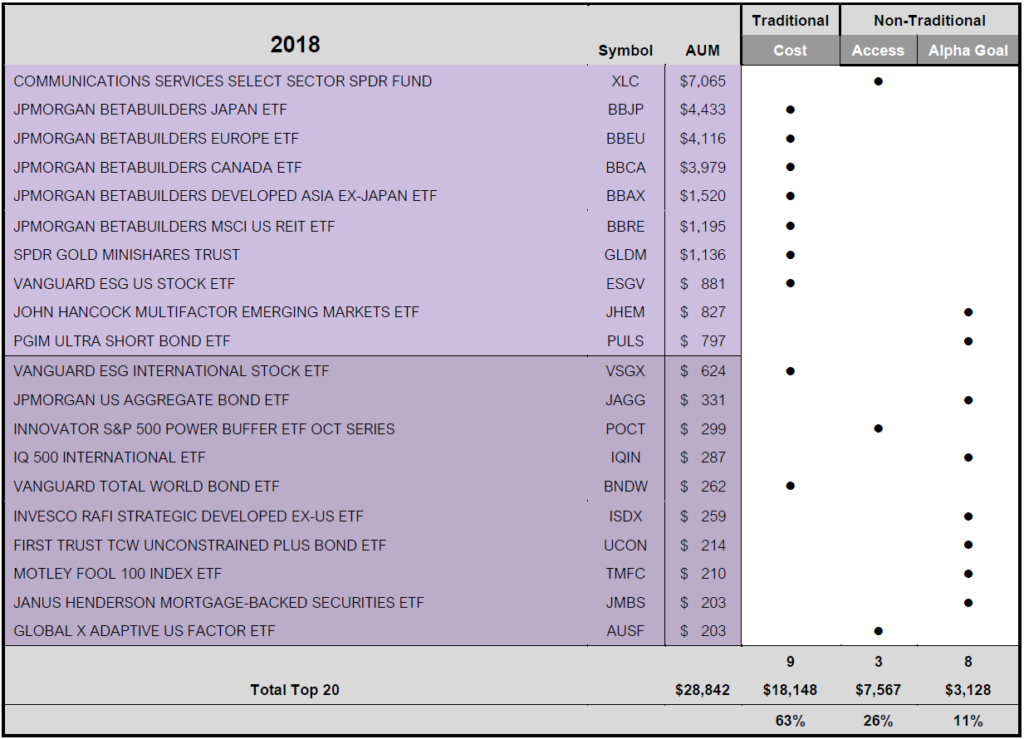
2018: SPDR Communications ETF is Launched and Quickly Captures Investors’ Attention
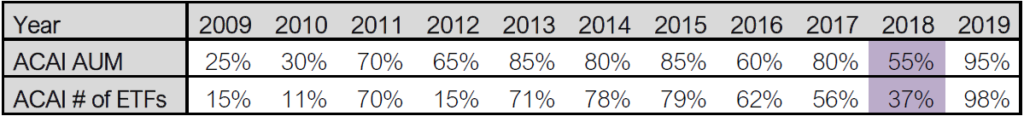
In a dynamic investment world, new ETF issuance must address the future. As a result, the Communication Services Select Sector SPDR® Fund (XLC) was launched in June 2018 as a new GICs category. The results also had effects on the Technology Select Sector SPDR® (XLK) and Consumer Discretionary Select Sector SPDR® Fund (XLY), as certain companies had to be reclassified.
In 2018, JP Morgan got serious about ETFs and launched a suite of “Beta Builders,” providing low-cost access to broad beta under the JP Morgan brand. Out of the $28 billion raised for the Top 20 ETFs in 2018, JP
Morgan’s suite of ETFs saw inflows of $15.2 billion. Excluding the $7 billion in AUM raised in the Communication Services Select Sector SPDR® Fund (XLC), JP Morgan took in 71% of all the money raised by the Top 20 ETFs in 2018.
Innovator Shares launched its Innovator S&P 500 Power Buffer ETF (POCT) in 2018. While this ETF solution barely shows up in the Top 20 line up, there have since been 40 broad launches, and the “Defined Outcome,” as a marketing solution, has been embraced by investors. Innovator Buffer Shares provide a solution that manages downside risk at the expense of potential upside options.
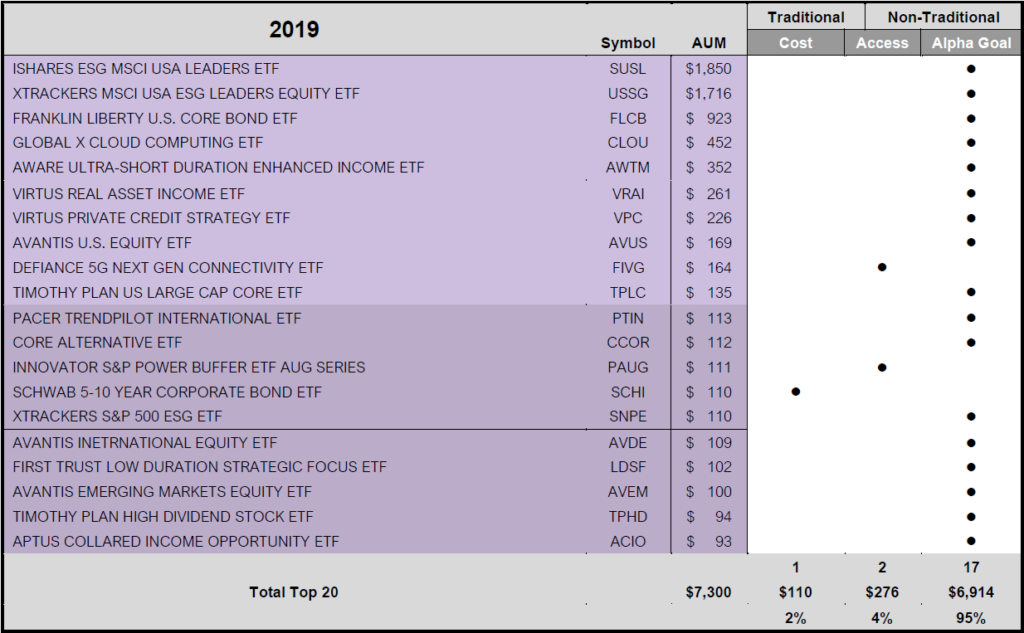
2019: Bring Your Own Assets (BYOA) Leads to ESG Inflows
In 2019, Bring Your Own Assets (BYOA) led the Top 20 Table with big seeds coming from different players. Led by example in the ways of investing in ESG, Keskinainen Elakevakuutusyhtio Ilmarinen, the $10 billion Finnish Pension fund, separately seeded two ETFs through iShares and Deutsch Bank (iShares ESG MSCI USA Leaders ETF (SUSL) and Xtrackers MSCI USA ESG Leaders Equity ETF (USSG)). Putting your money where your mouth is was also followed by the other Top 3 Launches, with seeds from Franklin Resources for Franklin Liberty U.S. Core Bond ETF (FLCB), Mirae Asset for Global X Cloud Computing ETF (CLOU,) and Blue Cross Blue Shields of Minnesota in the Aware Ultra-Short Duration Enhanced Income ETF (AWTM). Launching an ETF as BYOA is driven by investor-owner demand, according to specific situations and needs.
At the end of 2019, there were 38 ETFs (out of 230 ETFs launched) with AUM above $50 million. Note that there is no judgement being made about ETFs below $50 million, especially newly launched ETFs. Out of 1,623 launched between 2009 and 2019, there are 652 ETFs with AUM below $50 million. Some may go away and some may thrive – there is no crystal ball. Unlike mutual funds, ETFs are bought (not sold), and therefore no financial incentive exists for a salesperson to sell an ETF, other than meeting a portfolio goal.
Conclusion: ACAI Is Showing Positive Trends in Innovation
As measured by ACAI, the ETF industry is evolving and thriving with different types of investment solutions. AUM flows and popular mindshare might focus on price, but clearly, in the future, structure will matter in many of these solutions. The way that institutions and financial advisors use the ETF wrappers to reflect their fiduciary responsibilities in an overall portfolio will be essential to their ETF Strategy. Large institutions, like pension plans, endowments and/or insurance companies, may choose to build awareness of their ESG mission using the ETF wrapper. Family offices, whose beneficiaries are tax targets, could choose to launch ETFs with their own personal ESG message, that reflects the family values and helps to educate and involve their younger generations. The real question is whether or not hedge funds, with vast resources and marketing leverage, will choose to wrap part of their liquid alternatives in the transparent tax advantaged wrapper while trading other parts of their strategy. Innovation is just beginning!
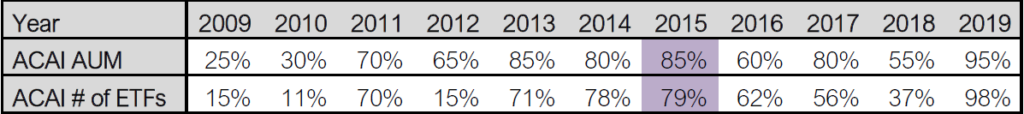
While ACAI may skew towards survivor bias as flows in the Top 20 ETFs change AUM each year, the process of identifying and highlighting innovation in the ETF industry is important. Investing in ETFs may be about lowering investor cost and certain Client Alignment factors, but it is not the sole reason why ETFs have been successful. We can reasonably believe that overall investor costs will continue to go down. However, innovation is more than just cost reduction. This is evidenced by the ACAI ratios in terms of both AUM and percentage of ETFs offering innovative solutions in the Top 20. These are steadily increasing – at a respective 25% and 15% in 2009, both are now over 95%. While numbers in the 90th percentile may be skewed by the shortness of 1 year in 2019, we note that the 3-year, 5-year and 7-year numbers are consistent; AUM is between 75% and 77% and numbers making the Top 20 are between 64% and 69%. With that in mind, we believe the evidence shows that investors in this new market will demand innovation as a core part of the ETF solutions in new launches.
Using the ETF wrapper to identify a SMART BET on active, access or alpha is the future of investing since investors want liquidity, tax efficiency and low cost. Over the past decade, flows into homogeneous low-cost ETFs have dominated the headlines, but if we know anything, it is that past performance should not be indicative of future outcomes. Investment markets and opportunities have evolved.
Addendum, Footnotes and Definitions:
1) FINRA definition between Active and Passive: https://www.finra.org/investors/insights/what-you-need-know-about-passive-vs-active-management-debate
2) Definition of Alpha: https://corporatefinanceinstitute.com/resources/knowledge/finance/alpha/
3) What is an Index fund: https://www.investopedia.com/terms/i/indexfund.asp
4) Active share: https://www.investopedia.com/terms/a/active-share-study.asp