This week, the ETF Think Tank research team revisits solutions for income investing. For many years, we have proposed that the use of income bar-bells may provide better risk-adjusted income than traditional dividend and bond investing. With all the volatility, confusion and stimulus, investing for income has become an active mine field. A few weeks back we noted that many of the worst performing ETFs are plagued with “zombies” like REITs:

The RAEI Ratio
We introduced the concept of a Risk Adjusted Excess Income (RAEI) ratio back in 2015. We have employed this metric to help ETF Think Tank members navigate income since then. The original piece can be found on ETF.com; an excerpt from the piece is below.
Risk Adjusted Excess Income Ratio = (Yield – Risk-Free Yield) / 3-Year Standard Deviation
Income Volatility has Returned
With all that has happened in the markets in 2020, we decided to revisit the RAEI for all ETFs. We started with traditional fixed income, considering the disruptions, discounts and volatility experienced thus far:
Short-term fixed income ETFs like iShares Short Treasury Bond ETF (SHV), iShares Short Maturity Municipal Bond ETF (MEAR) and Goldman Sachs Access Treasury 0-1 Year ETF (GBIL) seem to bar-bell low-risk per unit of income with more aggressive income approaches. Also interesting are the long-term treasuries with the worst RAEI scores due to increased volatility with low yields. Let’s now look at allocation funds:
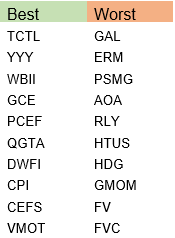
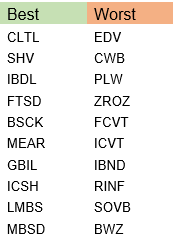
The closed end fund aggregation ETFs like CEFS, YYY and PCEF would compliment the short-term ETFs listed above. The worst RAEI scores go to tactical equity funds with no real yield, as expected. Now let’s look at the best and worst scores across all ETFs:
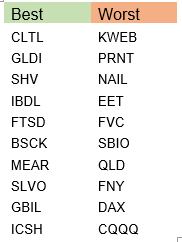
When looking at the entire ETF landscape, the short-term funds still look very attractive as the safety component. Interestingly, two commodity buy-write funds, GLDI and SLVO, screen very well; these can be used in combination with the allocation funds like CEFS. The ETFs that screen the worst are focused on growth or total return, so the ratio becomes less relevant. Our research team has used these metrics to create target income portfolios that can be viewed through this link: https://www.torosoam.com/images/pdf/IncomeFactSheetMay2020.pdf