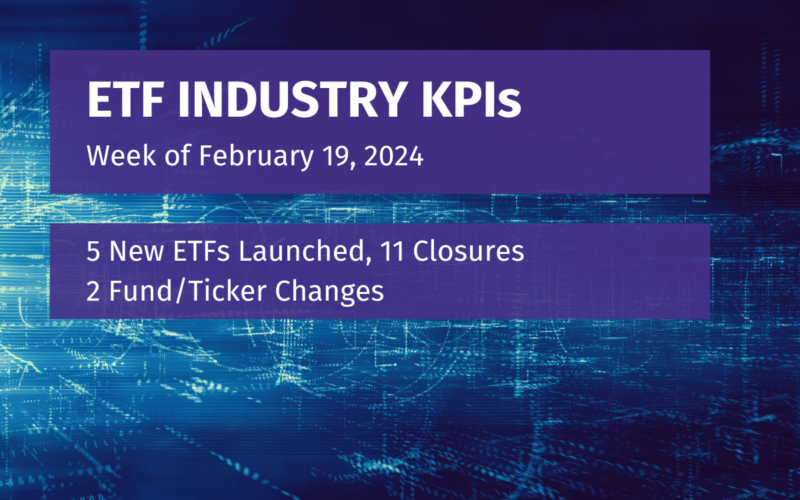
Week of February 19, 2024 KPI Summary
 Ryan Fitzgerald
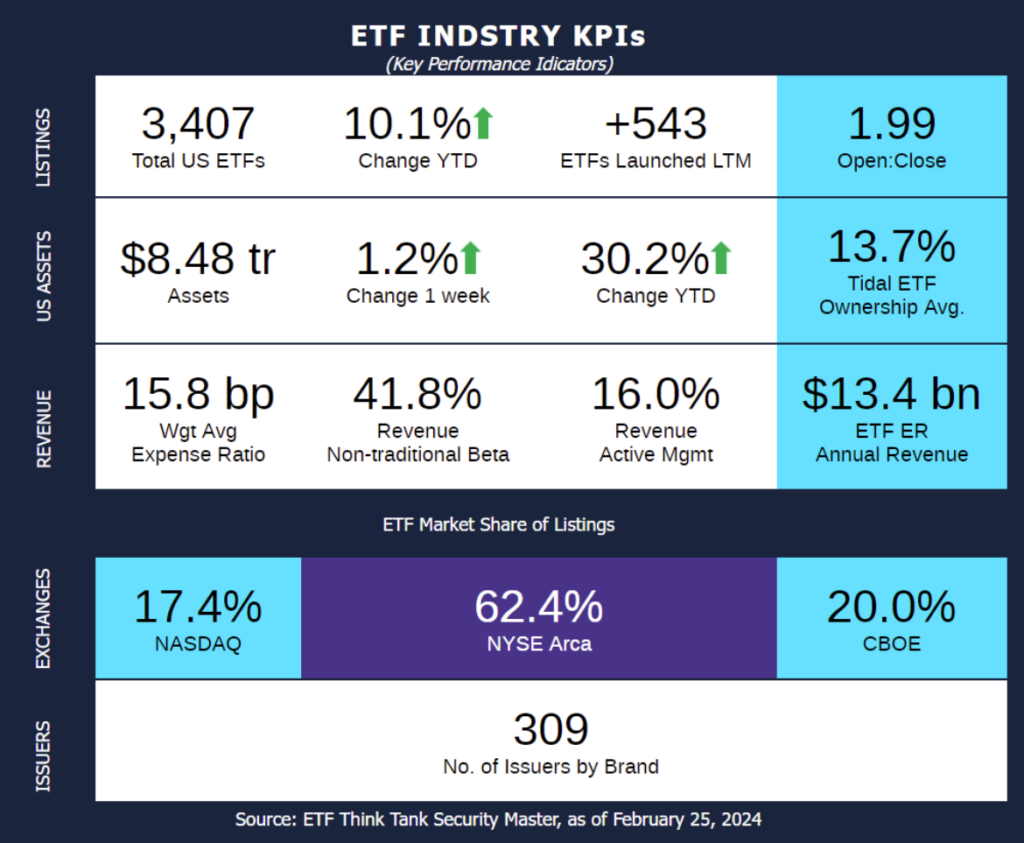
- This week, the industry experienced 5 ETF launches and 11 closures, shifting the 1-year Open-to-Close ratio to 1.99 and total US ETFs to 3,407.
- Happy National “Set a Good Example Day!” We’re sure you knew and are celebrating appropriately. However, if we are the first to tell you – yes, February 26 is this unique “holiday.” To commemorate the day, let’s take a look at the ETFs that have ESG as their General Attribute (according to the Tidal ETF Classification tool).
- There are currently 118 ESG ETFs totaling $81.4 Billion.
- iShares ESG Aware MSCI USA ETF (ESGU) has the most AUM with $13.5 Billion, with Vanguard’s ESGV and iShares’ ESGD next in line at $8.1B and $7.9B respectively.
- The top 10 ETFs in AUM constitute $52.4B of the $81.4B total (63%).
- The top performers:
- YTD: 11.5% for NWLG, Nuveen Winslow Large-Cap Growth ESG ETF.
- The group’s average is 2.4% compared to the ETF industry’s 30.2% change YTD.
- 1-year: 49.8% for QQMG, Invesco ESG NASDAQ 100 ETF.
- NWLG is in second place with 49.2%.
- The group’s average is 15.0% 1-year.
- Only 4 of the 109 ETFs that have 1-year performance available are negative.
- YTD: 11.5% for NWLG, Nuveen Winslow Large-Cap Growth ESG ETF.
- There are 36 Issuers maintaining the 118 ESG ETFs, with iShares having the most funds with 26.
- The average expense (bps) is 33.3 compared to the industry’s 52.9 bps.
- There are currently 118 ESG ETFs totaling $81.4 Billion.
- ESG ETFs aim to set a good example to the industry and investors alike. Regardless of your feelings on this group and its impact in reality, we should all want to set a good example today and every day (but today especially)!
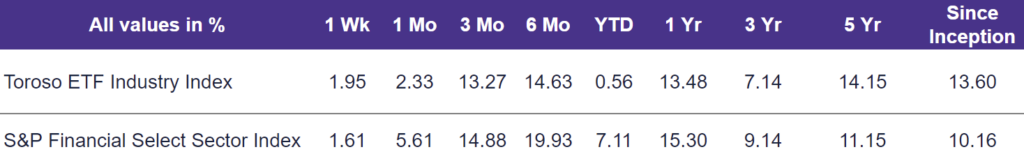
- The tracked indexes experienced similar performance last week. The Toroso ETF Industry Index was up 1.95% while the S&P Financial Select Sector Index trailed at 1.61%.
ETF Launches
FT Vest U.S. Small Cap Moderate Buffer ETF – February (ticker: SFEB)
FT Vest U.S. Equity Enhance & Moderate Buffer ETF – February (ticker: XFEB)
Fundamentals First ETF (ticker: KNOW)
YieldMax MSTR Option Income Strategy ETF (ticker: MSTY)
Valkyrie Bitcoin Futures Leveraged Strategy ETF (ticker: BTFX)
ETF Closures
SoFi Weekly Income ETF (ticker: TGIF)
SoFi Weekly Dividend ETF (ticker: WKLY)
SoFi Web 3 ETF (ticker: TWEB)
SoFi Smart Energy ETF (ticker: ENRG)
SoFi Be Your Own Boss ETF (ticker: BOYB)
Nationwide S&P 500 Risk-Managed Income ETF (ticker: NSPI)
Nationwide Russell 2000 Risk-Managed Income ETF (ticker: NTKI)
Nationwide Dow Jones Risk-Managed Income ETF (ticker: NDJI)
ERShares NextGen Entrepreneurs ETF (ticker: ERSX)
ERShares Entrepreneur ETF (ticker: ENTR)
AXS Cannabis ETF (ticker: THCX)
Fund/Ticker Changes
The Angel Oak High Yield Opportunities Fund (ticker: ANHIX)
became Angel Oak High Yield Opportunities ETF (ticker: AOHY)
The Angel Oak Total Return Bond Fund (ticker: AOIIX)
became Angel Oak Mortgage-Backed Securities ETF (ticker: MBS)
TETF.Index Performance vs. S&P Financial Select Sector Index
(as of February 23, 2024)
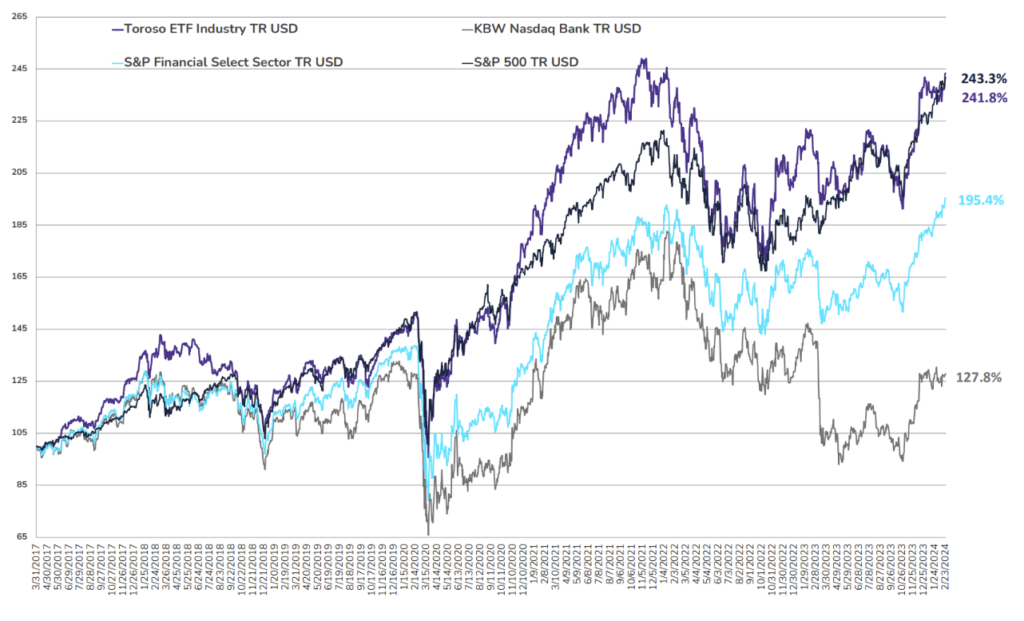
TETF.Index Performance vs. Other Leading Financial Indices
(March 31, 2017 through February 23, 2024)
Why Follow the ETF Industry KPIs
The team at Tidal Investments, originally operating as Toroso Investments, began tracking the ETF Industry Key Performance Indicators (KPIs) in the early 2000s and have been consistently reporting on, and analyzing these metrics ever since. This diligent tracking was the catalyst for the creation of the TETF.Index, an index that tracks the ETF industry. Now, as part of the Tidal Financial Group, which is affiliated with Tidal Investments, LLC, we are positioned to provide even more in-depth analysis and insights. Each week, we will share the statistics we believe to be the most useful for identifying industry trends, in addition to the performance of the TETF.Index.
DISCLAIMER
Past performance is no guarantee of future returns. This article is for informational and educational purposes only; is not intended to constitute legal, tax, accounting, or investment advice; and does not constitute an offer to sell or a solicitation of an offer to buy any security or service. Furthermore, the Indexes shown above are not investable. While Tidal Investments, LLC (formerly known as Toroso Investments, LLC) has gathered the information presented from sources that it believes to be reliable, Tidal Investments, LLC cannot guarantee the accuracy or completeness of the information presented and the information presented should not be relied upon as such. Any opinions expressed are Tidal Investments, LLC’s opinions and do not reflect the opinions of any affiliates or related persons. All opinions are current only as of the date of initial publication and are subject to change without notice. All investment strategies and investments involve risk of loss, including the possible loss of all amounts invested.