Week of July 12, 2021 KPI Summary
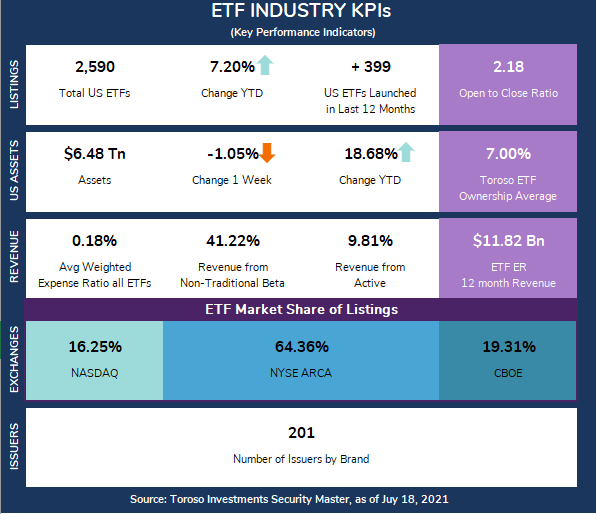
- This week, the industry experienced 15 new ETF launches and no closures, shifting the 2021 YTD Open-to-Close ratio to 2.18 and total US ETFs to 2,590.
- This week was a down week for ETF Assets (-1.05%), the lowest since mid-May.
- Two data points that jump out this week:
- 15 more ETF launches to make it +399 launches in the last 12-months. The Open-to-Close ratio of 2.18 has not been this high since March 2018.
- Secondly, the number of issuers by brand has crossed the 200 milestone this week. This is an increase of 66 in 3 years, according to our Security Master.
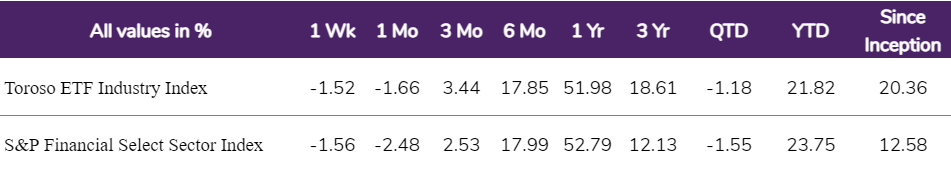
- Both indexes experienced minimal change this week, Toroso ETF Industry Index was down -1.52% while the S&P Financial Select Sector Index trailed at -1.56%.
ETF Launches
Cabana Target Leading Sector Aggressive ETF (ticker: CLSA)
Cabana Target Leading Sector Conservative ETF (ticker: CLSC)
Cabana Target Leading Sector Moderate ETF (ticker: CLSM)
FT Cboe Vest US Equity Uncapped Buffer15 ETF [Month] (ticker: XJUN)
Global X AgTech & Food Innovation ETF (ticker: KROP)
Global X Blockchain ETF (ticker: BKCH)
Global X Hydrogen ETF (ticker: HYDR)
Pacer Metaurus US Large Cap Dividend Multiplier 300 ETF (ticker: TRPL)
Pacer Metaurus US Large Cap Dividend Multiplier 400 ETF (ticker: QDPL)
Defiance Next Gen Big Data ETF (ticker: BIGY)
FIS Knights of Columbus Global Belief ETF (ticker: KOCG)
Goldman Sachs Future Planet Equity ETF (ticker: GSFP)
iShares iBonds Dec 2031 Term Treasury ETF (ticker: IBTL)
Jacob Forward ETF (ticker: JFWD)
ATAC Credit Rotation ETF (ticker: JOJO)
TETF.Index Performance vs. S&P Financial Select Sector Index
(as of July 16, 2021)
TETF.Index Performance vs. Other Leading Financial Indices
(March 31, 2017 through July 16, 2021)
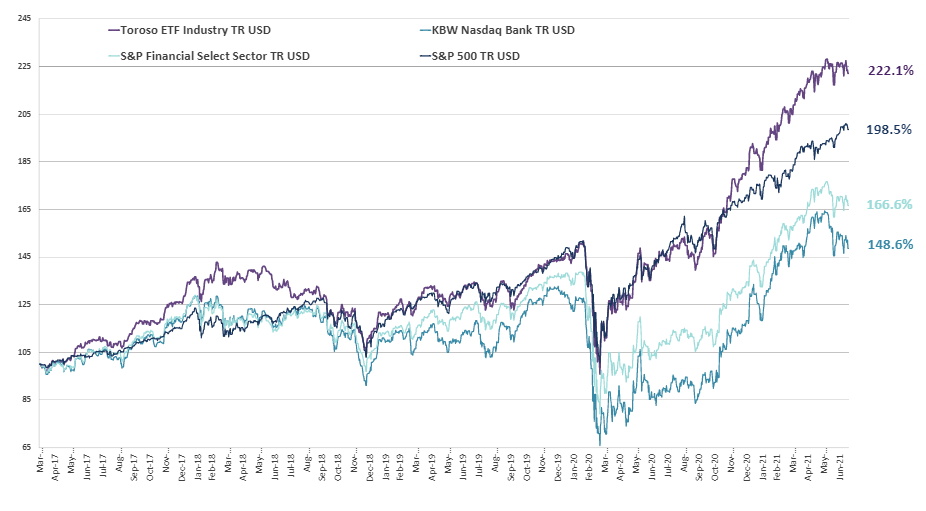
Source: Morningstar Direct
Why Follow the ETF Industry KPIs
The team at Toroso Investments began tracking the ETF Industry Key Performance Indicators (KPI’s) in the early 2000’s and have been consistently reporting on, and analyzing these metrics ever since. The table above was the impetus for the creation of the TETF.Index, the index that tracks the ETF industry. Each week, we will share the statistics we believe to be the most useful for identifying industry trends, in addition to the performance of the TEFT.Index.
DISCLAIMER
Past performance is no guarantee of future returns. This article is for informational and educational purposes only; is not intended to constitute legal, tax, accounting or investment advice; and does not constitute an offer to sell or a solicitation of an offer to buy any security or service. Furthermore, the Indexes shown above are not investable. While Toroso has gathered the information presented from sources that it believes to be reliable, Toroso cannot guarantee the accuracy or completeness of the information presented and the information presented should not be relied upon as such. Any opinions expressed are Toroso’s opinions and do not reflect the opinions of any affiliates or related persons. All opinions are current only as of the date of initial publication and are subject to change without notice. All investment strategies and investments involve risk of loss, including the possible loss of all amounts invested.