Week of March 18, 2024 KPI Summary
 Ryan Fitzgerald
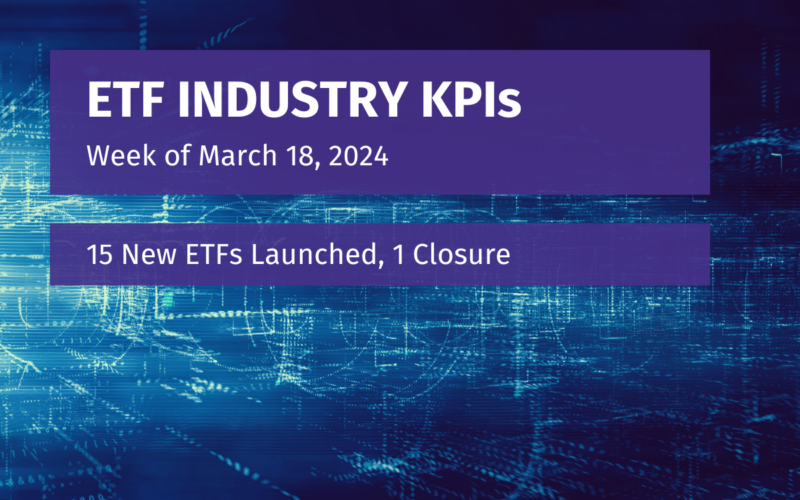
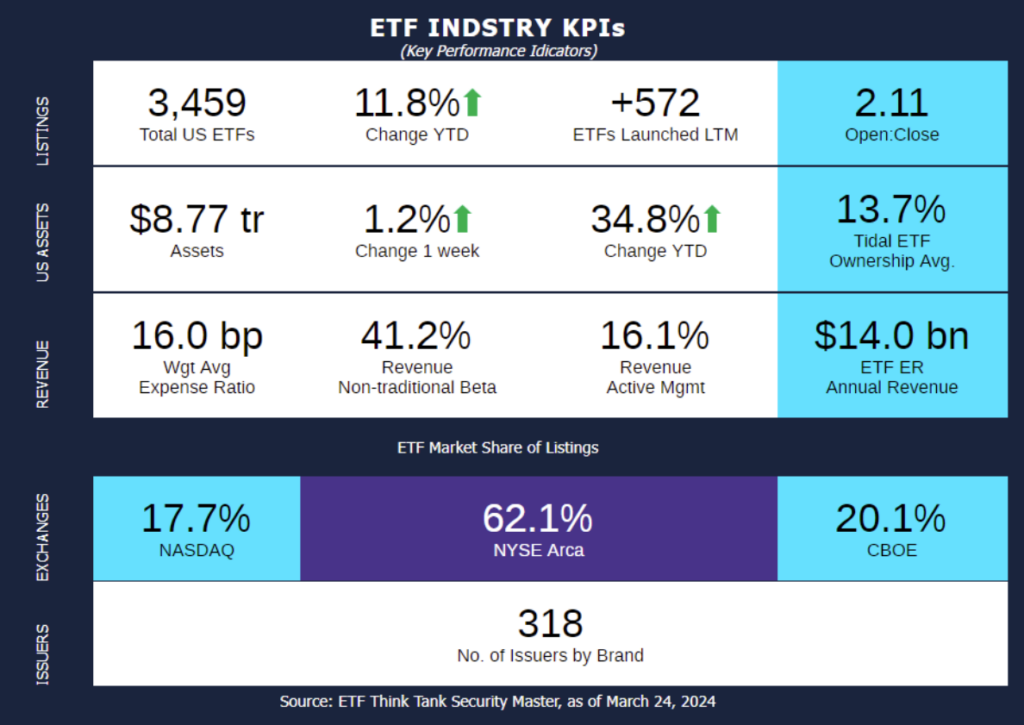
- This week, the industry experienced 15 ETF launches and 1 closure, shifting the 1-year Open-to-Close ratio to 2.11 and total US ETFs to 3,459.
- This past week was a mild week for the ETF industry with a small uptick in amount of total funds and 1.2% change in assets. Similarly, March Madness, the NCAA Men’s Basketball championship bracket, has not had many crazy upsets advance to the ‘Sweet 16’ (as it’s known for every year). Last year, zero 1-seeds got to the final 8. Meanwhile this year, all the 1 and 2 seeds are still alive with 16 teams left.
- As a fun comparison for this week and next, let’s compare some of the teams remaining to the top ETF issuers by AUM and see if you can predict the rest of the bracket that way!
- Pre-tournament, the two major favorites were UConn and Houston with Purdue close behind. In the ETF industry:
- UConn = iShares – largest AUM with $2.73 Tn and ~31.2% market shares.
- Houston = Vanguard – 2nd largest AUM but gaining on iShares.
- The gap this time last year (3/25/23) was 4.4% market share and today it’s 2.1%.
- Purdue = State Street — 3rd in AUM and a popular outside favorite to win it all!
- The final 1-seed, North Carolina, will be our blue and white issuer, Invesco, who has 20 additional funds over the past 1-year.
- The remaining 4 issuers that each have over 1% market share are Charles Schwab, First Trust, JP Morgan, and Dimensional. These will be our 2 seeds represented by Arizona, Iowa State, Tennessee, and Marquette.
- Fidelity is #12 on the total AUM list, passing Global X in the past year. They will represent the rising small school Creighton and blue-blood program Duke.
- Lastly, the only “Cinderella team” remaining is 11-seed NC state, which means they probably fall in the #41-44 ranked teams pre-tournament. As a result, they are the 43rd largest Issuer T. Rowe Price, since they are headquartered nearby in Maryland.
- Pre-tournament, the two major favorites were UConn and Houston with Purdue close behind. In the ETF industry:
- If your team wasn’t mentioned, reach out and we will assign them an issuer equivalent! Who will make the Final 4 by next week?
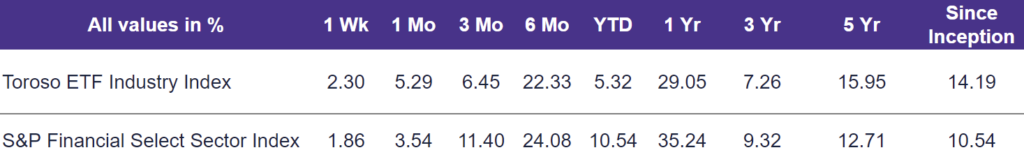
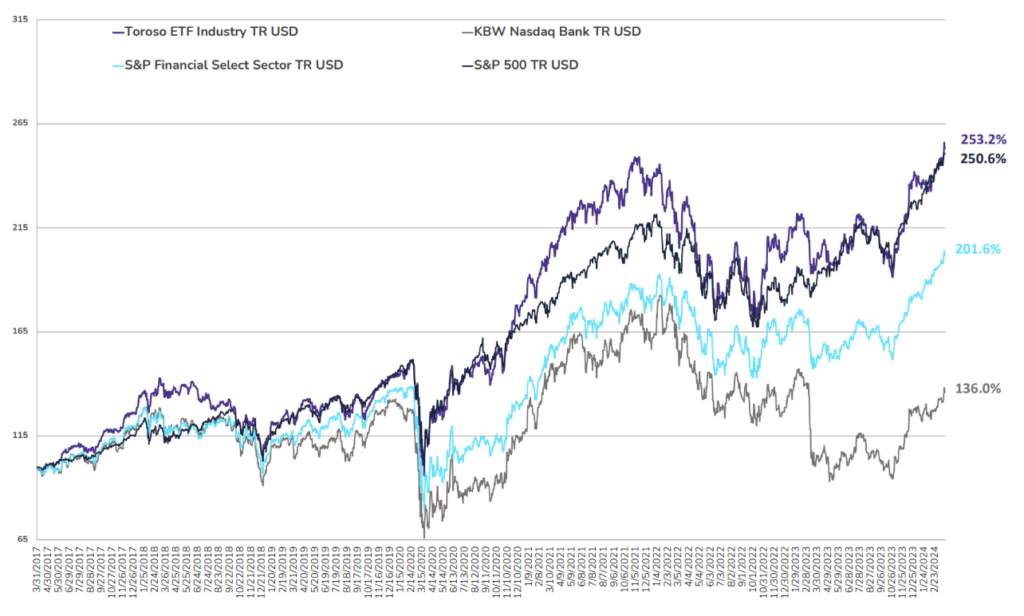
- The tracked indexes experienced similar performance last week. The Toroso ETF Industry Index was up 2.30% while the S&P Financial Select Sector Index trailed at 1.86%.
ETF Launches
Alerian MLP Index ETN (ticker: AMJB)
Avantis Emerging Markets Ex-China Equity ETF (ticker: AVXC)
Bancreek International Large Cap ETF (ticker: BCIL)
FT Vest Dow Jones Internet & Target Income ETF (ticker: FDND)
FT Vest U.S. Equity Buffer & Premium Income ETF – March (ticker: XIMR)
Global X Bitcoin Trend Strategy ETF (ticker: BTRN)
GraniteShares 2x Long AMD Daily ETF (ticker: AMDL)
GraniteShares 2x Long AMZN Daily ETF (ticker: AMZZ)
GraniteShares 2x Long MSFT Daily ETF (ticker: MSFL)
Hartford Multifactor International Small Company ETF (ticker: ROIS)
iShares Energy Storage & Materials ETF (ticker: IBAT)
Neuberger Berman Small-Mid Cap ETF (ticker: NBSM)
Opportunistic Trader ETF (ticker: WZRD)
Pacer Developed Markets Cash Cows Growth Leaders ETF (ticker: EAFG)
ProShares Nasdaq-100 High Income ETF (ticker: IQQQ)
ETF Closures
VanEck Egypt ETF (ticker: EGPT)
Fund/Ticker Changes
None
TETF.Index Performance vs. S&P Financial Select Sector Index
(as of March 22, 2024)
TETF.Index Performance vs. Other Leading Financial Indices
(March 31, 2017 through March 22, 2024)
Why Follow the ETF Industry KPIs
The team at Tidal Investments, originally operating as Toroso Investments, began tracking the ETF Industry Key Performance Indicators (KPIs) in the early 2000s and have been consistently reporting on, and analyzing these metrics ever since. This diligent tracking was the catalyst for the creation of the TETF.Index, an index that tracks the ETF industry. Now, as part of the Tidal Financial Group, which is affiliated with Tidal Investments, LLC, we are positioned to provide even more in-depth analysis and insights. Each week, we will share the statistics we believe to be the most useful for identifying industry trends, in addition to the performance of the TETF.Index.
DISCLAIMER
Past performance is no guarantee of future returns. This article is for informational and educational purposes only; is not intended to constitute legal, tax, accounting, or investment advice; and does not constitute an offer to sell or a solicitation of an offer to buy any security or service. Furthermore, the Indexes shown above are not investable. While Tidal Investments, LLC (formerly known as Toroso Investments, LLC) has gathered the information presented from sources that it believes to be reliable, Tidal Investments, LLC cannot guarantee the accuracy or completeness of the information presented and the information presented should not be relied upon as such. Any opinions expressed are Tidal Investments, LLC’s opinions and do not reflect the opinions of any affiliates or related persons. All opinions are current only as of the date of initial publication and are subject to change without notice. All investment strategies and investments involve risk of loss, including the possible loss of all amounts invested.