Week of June 26, 2023 KPI Summary
 Ryan Fitzgerald
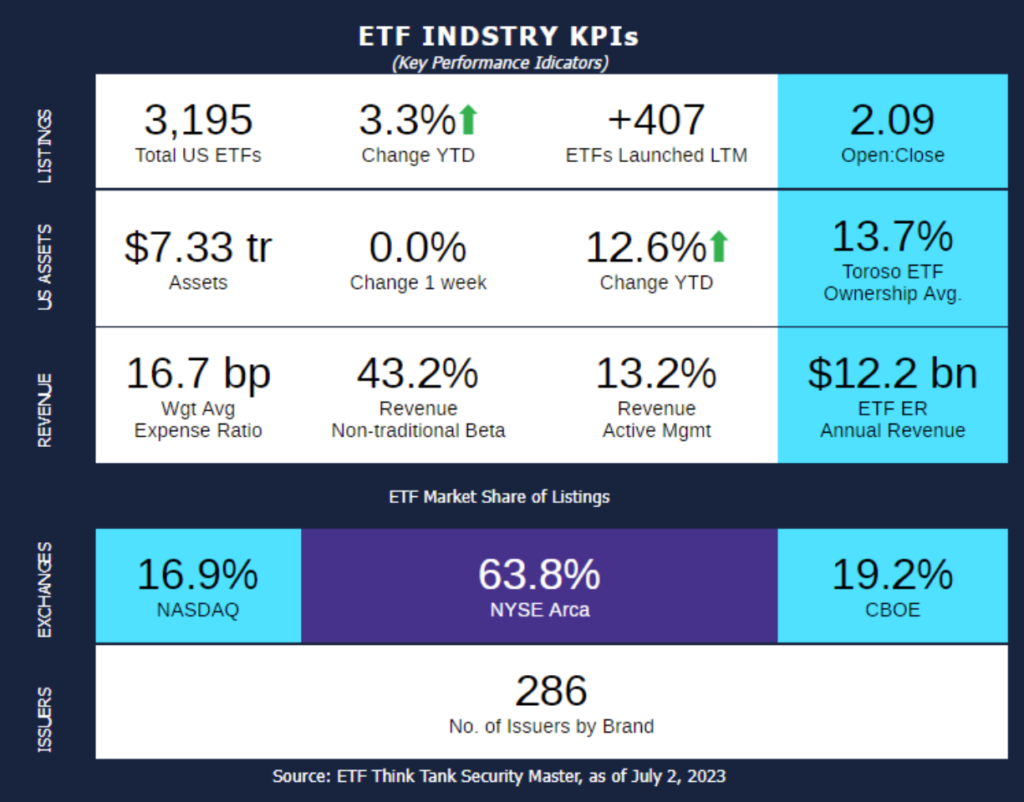
- This week, the industry experienced 20 ETF launches and 10 closures, shifting the 1-year Open-to-Close ratio to 2.09 and total US ETFs to 3,195. This is the largest number of launches and closures reported in some time.
- June capped off 4 consecutive months of positive asset growth and is the greatest of the 4. Let’s check out some other notable data from June. (Data comparing 6/11/23-7/2/23 – the first 11 days of June were used in the May overview)
- Total assets increased 2.49%, there was an increase of 29 ETFs to total US ETF count (3,162), and -1 additional issuers by brand.
- From our 11 asset class categories, Geared/Swaps increased the most (5.4%) with Allocation next (3.3%). Currency had the worst performance again (-10.2%) with Commodities Physical at second worst (-4.0%). The two largest asset classes of Equity (76.8% of assets) and Fixed Income (18.7%) rose 3.1% and 0.8% respectively.
- Geared Swaps had the most increase for May and June.
- Currency has been in the bottom 2 for the past 4 months.
- The ETF expense ratio annual revenue inched up from $11.9 Bn to $12.2 Bn.
- June takes the silver medal from May as the second-best month in US ETF asset growth in 2023. Total assets have increased for the 4th month in a row. Remarkable, considering last month we mentioned that 3 months in a row hadn’t happened in 2+ years. Great increase of total ETFs (29), yet a surprising drop in issuer count as well.
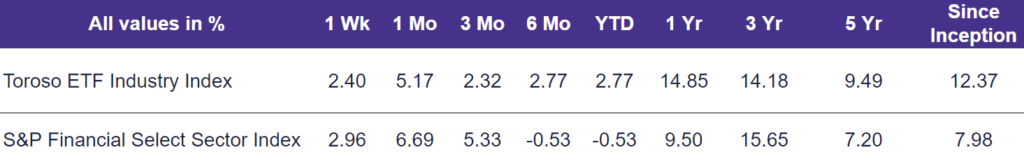
- The tracked indexes had similar positive experiences in June. The Toroso ETF Industry Index was up 5.2% while the S&P Financial Select Sector Index led at 6.7%.
ETF Launches
Avantis All Equity Markets Value ETF (ticker: AVGV)
Avantis Moderate Allocation ETF (ticker: AVMA)
Avantis All International Markets Equity ETF (ticker: AVNM)
Avantis All International Markets Value ETF (ticker: AVNV)
iMGP Berkshire Dividend Growth ETF (ticker: BDVG)
2x Bitcoin Strategy ETF (ticker: BITX)
Simplify Opportunistic Income ETF (ticker: CRDT)
Dimensional California Municipal Bond ETF (ticker: DFCA)
iShares iBonds December 2033 Term Corporate ETF (ticker: IBDY)
iShares iBonds 2030 Term High Yield & Income ETF (ticker: IBHJ)
iShares iBonds December 2033 Term Treasury ETF (ticker: IBTO)
iShares Copper and Metals Mining ETF (ticker: ICOP)
iShares Lithium Miners and Producers ETF (ticker: ILIT)
iShares Large Cap Deep Buffer ETF (ticker: IVVB)
iShares Large Cap Moderate Buffer ETF (ticker: IVVM)
Natixis Loomis Sayles Focused Growth ETF (ticker: LSGR)
MAX Airlines -3X Inverse Leveraged ETN (ticker: JETD)
MAX Airlines 3X Leveraged ETN (ticker: JETU)
MAX Auto Industry -3X Inverse Leveraged ETN (ticker: CARD)
MAX Auto Industry 3X Leveraged ETN (ticker: CARU)
ETF Closures
AXS 2X NKE Bull Daily ETF (ticker: NKEL)
AXS 2X NKE Bear Daily ETF (ticker: NKEQ)
AXS 2X PFE Bull Daily ETF (ticker: PFEL)
AXS 2X PFE Bear Daily ETF (ticker: PFES)
AXS 1.5X PYPL Bear Daily ETF (ticker: PYPS)
AXS Short De-SPAC Daily ETF (ticker: SOGU)
AXS Short China Internet ETF (ticker: SWEB)
GraniteShares 1x Short TSLA Daily ETF (ticker: TSLI)
Constrained Capital ESG Orphans ETF (ticker: ORFN)
UVA Dividend Value ETF (ticker: UVDV)
Fund/Ticker Changes
None
TETF.Index Performance vs. S&P Financial Select Sector Index
(as of June 30, 2023)
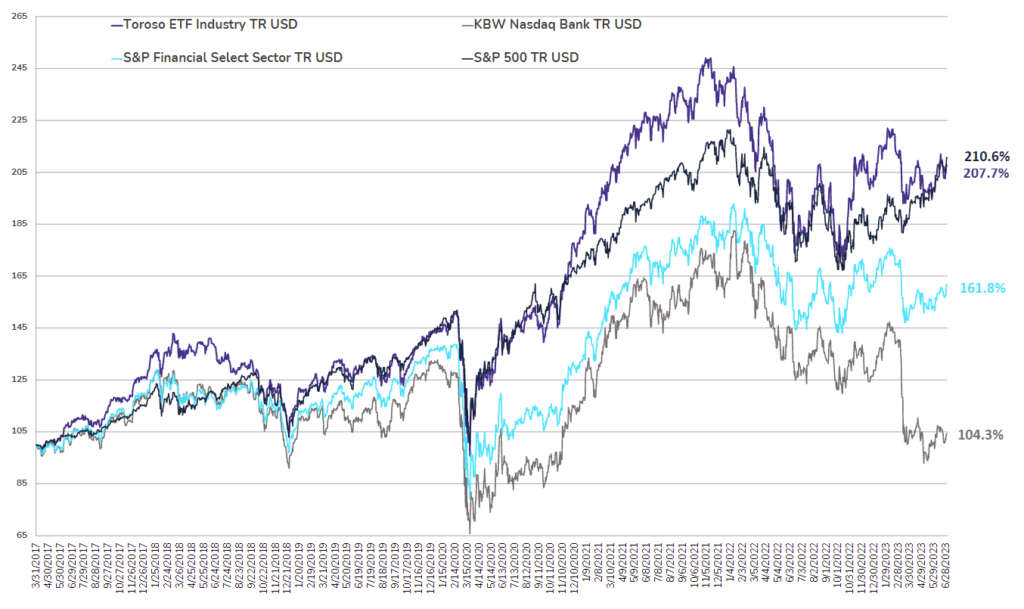
TETF.Index Performance vs. Other Leading Financial Indices
(March 31, 2017 through June 30, 2023)
Why Follow the ETF Industry KPIs
The team at Toroso Investments began tracking the ETF Industry Key Performance Indicators (KPI’s) in the early 2000’s and have been consistently reporting on, and analyzing these metrics ever since. The table above was the impetus for the creation of the TETF.Index, the index that tracks the ETF industry. Each week, we will share the statistics we believe to be the most useful for identifying industry trends, in addition to the performance of the TEFT.Index.
DISCLAIMER
Past performance is no guarantee of future returns. This article is for informational and educational purposes only; is not intended to constitute legal, tax, accounting or investment advice; and does not constitute an offer to sell or a solicitation of an offer to buy any security or service. Furthermore, the Indexes shown above are not investable. While Toroso has gathered the information presented from sources that it believes to be reliable, Toroso cannot guarantee the accuracy or completeness of the information presented and the information presented should not be relied upon as such. Any opinions expressed are Toroso’s opinions and do not reflect the opinions of any affiliates or related persons. All opinions are current only as of the date of initial publication and are subject to change without notice. All investment strategies and investments involve risk of loss, including the possible loss of all amounts invested.