Week of February 5, 2024 KPI Summary
 Ryan Fitzgerald
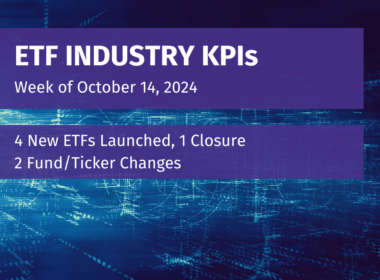
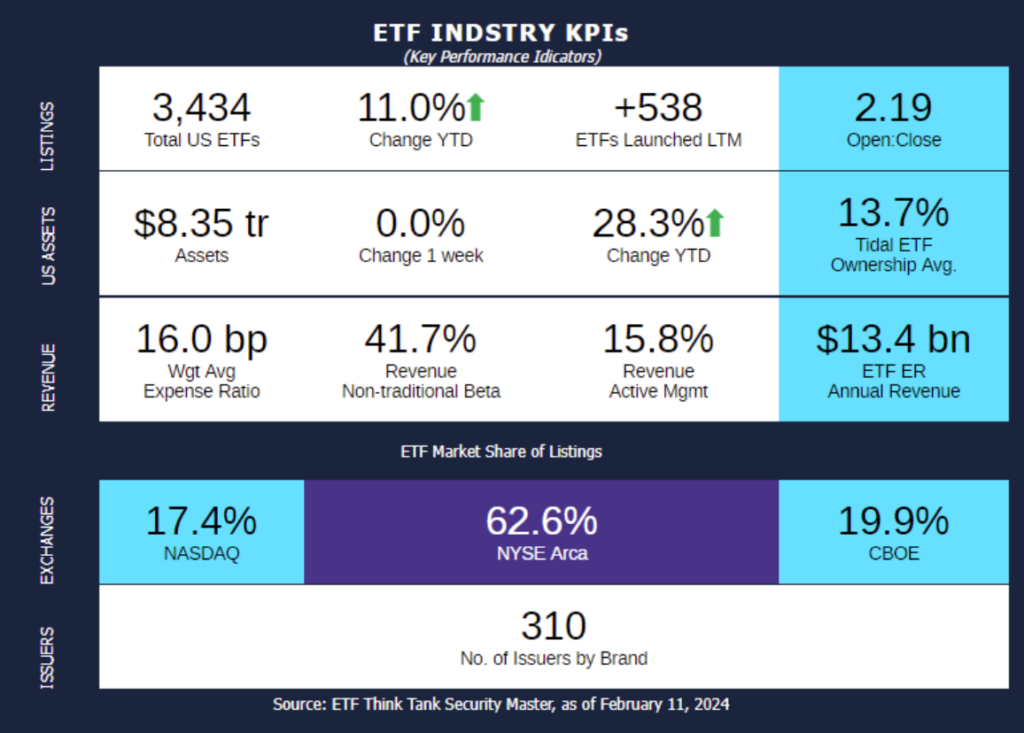
- This week, the industry experienced 3 ETF launches and 0 closures, shifting the 1-year Open-to-Close ratio to 2.19 and total US ETFs to 3,434.
- What a Superbowl Sunday it was yesterday! The Superbowl is the U.S.’s biggest sporting event every year by far. In that spirit, let’s do a check-up on the U.S. ETF category as whole.
- US ETFs make up 78.6% of total ETF industry assets ($6.56T of $8.35T).
- There are approximately 1,575 US ETFs of the total 3,434.
- The average expense for these ETFs is 48.6 bps; 14.3 bps weighted average.
- The top 25 US ETFs combine for $3.35T, more than half of the $6.56T total (51.1%).
- 21 of these funds are listed on the NYSE, the remaining 4 on the Nasdaq.
- The average 3-month performance of these 25 ETFs is 14.8%, with the median at 16.1%.
- The best performing fund in this time period is VGT, Vanguard Information Technology, at 20.3%.
- On the other hand, the worst performing fund of the top 25 is BND, Vanguard Total Bond Market, at 4.9%.
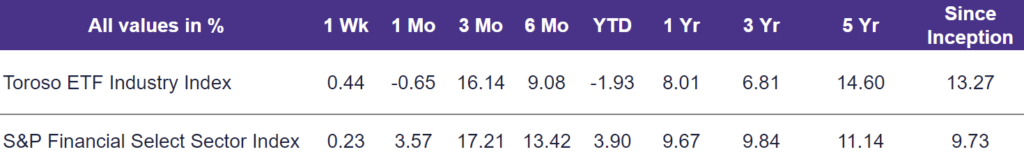
- The tracked indexes experienced similar performance last week. The Toroso ETF Industry Index was up 0.44% while the S&P Financial Select Sector Index trailed at 0.23%.
ETF Launches
Eaton Vance Floating-Rate ETF (ticker: EVLN)
American Beacon GLG Natural Resources ETF (ticker: MGNR)
Direxion Daily MSCI Emerging Markets Ex China BulI 2X ETF (ticker: XXCH)
ETF Closures
None
Fund/Ticker Changes
None
TETF.Index Performance vs. S&P Financial Select Sector Index
(as of February 9, 2024)
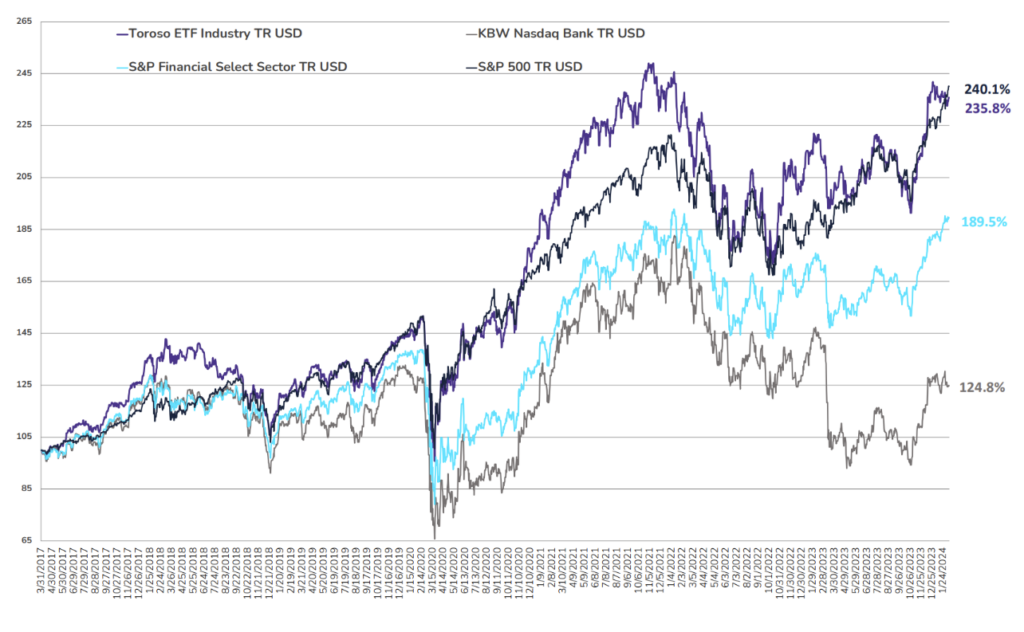
TETF.Index Performance vs. Other Leading Financial Indices
(March 31, 2017 through February 9, 2024)
Why Follow the ETF Industry KPIs
The team at Tidal Investments, originally operating as Toroso Investments, began tracking the ETF Industry Key Performance Indicators (KPIs) in the early 2000s and have been consistently reporting on, and analyzing these metrics ever since. This diligent tracking was the catalyst for the creation of the TETF.Index, an index that tracks the ETF industry. Now, as part of the Tidal Financial Group, which is affiliated with Tidal Investments, LLC, we are positioned to provide even more in-depth analysis and insights. Each week, we will share the statistics we believe to be the most useful for identifying industry trends, in addition to the performance of the TETF.Index.
DISCLAIMER
Past performance is no guarantee of future returns. This article is for informational and educational purposes only; is not intended to constitute legal, tax, accounting, or investment advice; and does not constitute an offer to sell or a solicitation of an offer to buy any security or service. Furthermore, the Indexes shown above are not investable. While Tidal Investments, LLC (formerly known as Toroso Investments, LLC) has gathered the information presented from sources that it believes to be reliable, Tidal Investments, LLC cannot guarantee the accuracy or completeness of the information presented and the information presented should not be relied upon as such. Any opinions expressed are Tidal Investments, LLC’s opinions and do not reflect the opinions of any affiliates or related persons. All opinions are current only as of the date of initial publication and are subject to change without notice. All investment strategies and investments involve risk of loss, including the possible loss of all amounts invested.