Week of January 8, 2024 KPI Summary
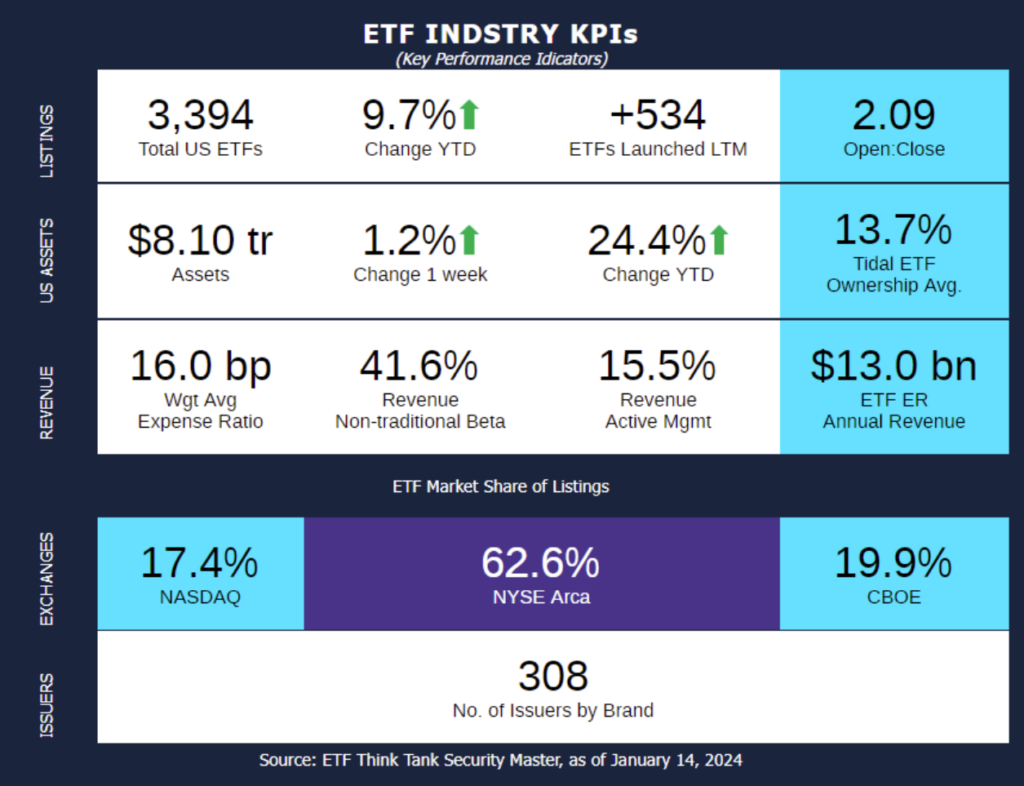
- This week, the industry experienced 17 ETF launches and 3 closures, shifting the 1-year Open-to-Close ratio to 2.09 and total US ETFs to 3,394.
- As we exit the Holiday season, we recognize the massive amount of spending that Americans put towards gifts for their family and friends. We can come out of the Holidays in a financial whirlwind. In this light, we want to feature a certain group of ETFs: The 100 most expensive ETFs.
- We took the 100 most expensive ETFs by Expense Ratio and measured them against each other. These ETFs range from 1,118 to 122 bps, with the median being 141 bps.
- These 100 ETFs combine for $28.1 Billion AUM, only 0.37% of total industry ($8.1 Trillion).
- The largest fund is SOXL, Direxion Daily Semiconductor Bull 3X ETF, with $7.6B currently. This is more than double the next largest fund, SPXL.
- While the average fund size is $280 Million due to some top heaviness of the 100, the median fund is $50 Million.
- The largest fund that isn’t a Bull 3X ETF is First Trust Long/Short Equity ETF, FTLS, at $899 Million.
- The largest fund is SOXL, Direxion Daily Semiconductor Bull 3X ETF, with $7.6B currently. This is more than double the next largest fund, SPXL.
- There are 13 ETFs with total management expenses over 2.00% with the most exorbitant being MAXI, Simplify Bitcoin Strategy PLUS Inc ETF, being 11.18%.
- While the average performance over the last 3 months has been 10.0% growth, the top performer pulling that average up is NAIL, Direxion Daily Homebuilders & Supplies Bull 3X ETF, with 123.6% increase. It is also the 2nd best performing ETF of the group over a 1-year period with 172.2% growth.
- Many of the negatively performing ETFs on a 3-month and 12-month basis are Bear 2x and 3x ETFs. The best performing ETF of this group (18 ETFs) on a 3-month timeline is Direxion Daily FTSE China Bear 3X ETF, YANG, at 42.7%.
- There are 35 issuers responsible for these 100 ETFs, with Direxion having the most funds by far with 40 ETFs. The issuer with the next most is ProShares with 5 ETFs.
- Surprisingly, there is a lot of dispersion amongst the Exchanges. NYSE houses 81 of these ETFs, then CBOE with 16, and Nasdaq with the remaining 3 ETFs.
- These 100 ETFs combine for $28.1 Billion AUM, only 0.37% of total industry ($8.1 Trillion).
- The ETF industry is always evolving. Over the last few years, we have seen the trend of extremely low-cost ETFs potentially converge with a preference of quality and active management. As Aldo Gucci once said, “Quality is remembered long after price is forgotten.” These 100 ETFs attempt to shine the truth in this statement.
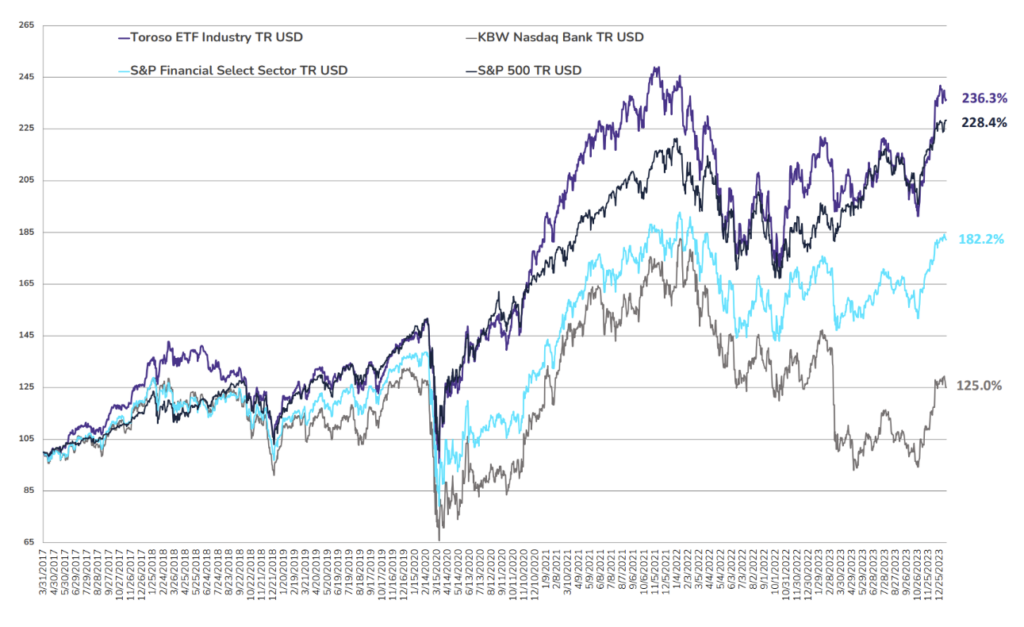
- The tracked indexes had similar experiences in the past week. The Toroso ETF Industry Index was down -0.54% while the S&P Financial Select Sector Index led at -0.51%.
ETF Launches
T-Rex 2X Long Apple Daily Target ETF (ticker: AAPX)
ARK 21Shares Bitcoin ETF (ticker: ARKB)
Bitwise Bitcoin ETF (ticker: BITB)
Valkyrie Bitcoin ETF (ticker: BRRR)
Invesco Galaxy Bitcoin ETF (ticker: BTCO)
WisdomTree Bitcoin ETF (ticker: BTCW)
IDX Dynamic Fixed Income ETF (ticker: DYFI)
Franklin Bitcoin ETF (ticker: EZBC)
Fidelity Wise Origin Bitcoin ETF (ticker: FBTC)
T-Rex 2X Long Alphabet Daily Target ETF (ticker: GOOX)
Vaneck Bitcoin Trust ETF (ticker: HODL)
Vest 2 Year Interest Rate Hedge ETF (ticker: HYKE)
iShares Bitcoin Trust ETF (ticker: IBIT)
T-Rex 2X Long Microsoft Daily Target ETF (ticker: MSFX)
F/M 10-Year Investment Grade Corporate Bond ETF (ticker: ZTEN)
F/M 3-Year Investment Grade Corporate Bond ETF (ticker: ZTRE)
F/M 2-Year Investment Grade Corporate Bond ETF (ticker: ZTWO)
ETF Closures
Goldman Sachs ActiveBeta Paris-Aligned US Large Cap Equity ETF (ticker: GPAL)
V-Shares US Leadership Diversity ETF (ticker: VDNI)
V-Shares MSCI World ESG Materiality and Carbon Transition ETF (ticker: VMAT)
Fund/Ticker Changes
None
TETF.Index Performance vs. S&P Financial Select Sector Index
(as of January 12, 2024)

TETF.Index Performance vs. Other Leading Financial Indices
(March 31, 2017 through January 12, 2024)
Why Follow the ETF Industry KPIs
The team at Tidal Investments, originally operating as Toroso Investments, began tracking the ETF Industry Key Performance Indicators (KPIs) in the early 2000s and have been consistently reporting on, and analyzing these metrics ever since. This diligent tracking was the catalyst for the creation of the TETF.Index, an index that tracks the ETF industry. Now, as part of the Tidal Financial Group, which is affiliated with Tidal Investments, LLC, we are positioned to provide even more in-depth analysis and insights. Each week, we will share the statistics we believe to be the most useful for identifying industry trends, in addition to the performance of the TETF.Index.
DISCLAIMER
Past performance is no guarantee of future returns. This article is for informational and educational purposes only; is not intended to constitute legal, tax, accounting, or investment advice; and does not constitute an offer to sell or a solicitation of an offer to buy any security or service. Furthermore, the Indexes shown above are not investable. While Tidal Investments, LLC (formerly known as Toroso Investments, LLC) has gathered the information presented from sources that it believes to be reliable, Tidal Investments, LLC cannot guarantee the accuracy or completeness of the information presented and the information presented should not be relied upon as such. Any opinions expressed are Tidal Investments, LLC’s opinions and do not reflect the opinions of any affiliates or related persons. All opinions are current only as of the date of initial publication and are subject to change without notice. All investment strategies and investments involve risk of loss, including the possible loss of all amounts invested.


