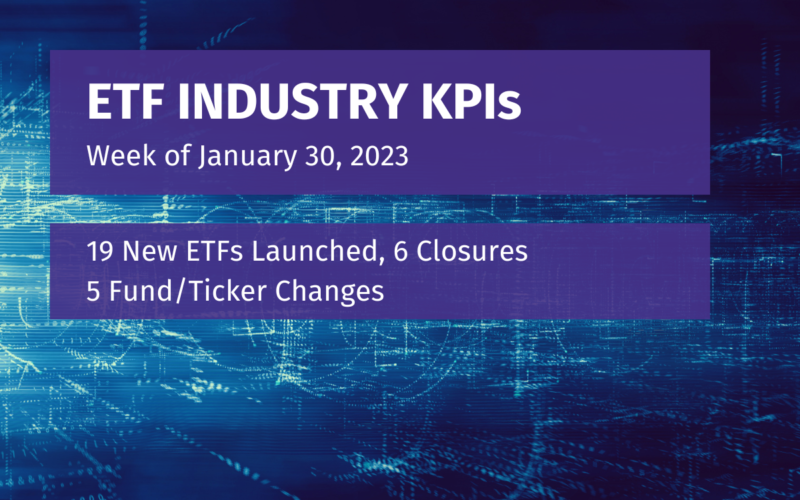
Week of January 30, 2023 KPI Summary
 Ryan Fitzgerald
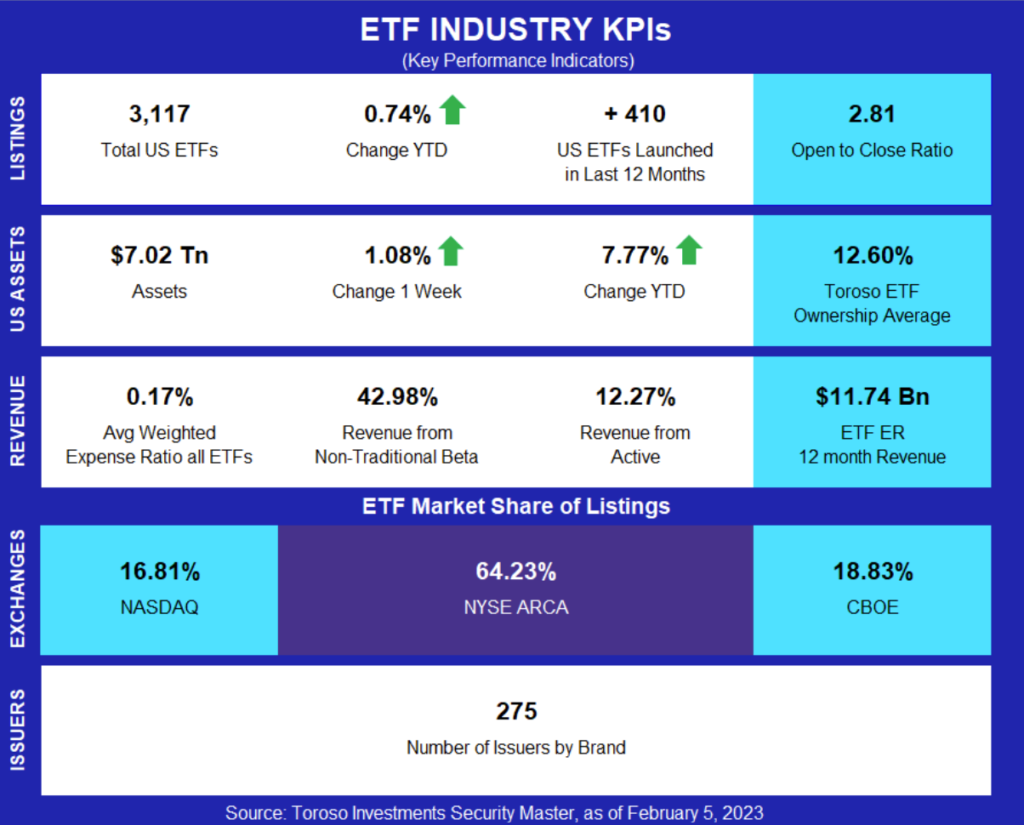
- This week, the industry experienced 19 ETF launches and 6 closures, shifting the 1-year Open-to-Close ratio to 2.81 and total US ETFs to 3,117.
- January was a very positive month in the ETF industry, so let’s go over some KPIs that stood out to us. Note the data below will compare 12/31/22 KPIs to 2/5/23.
- Total assets increased 7.77%, there was an increase of 23 ETFs to total US ETF count (3,033), and 0 additional issuers by brand.
- This is massively different from January 2022 which featured -5.7% decline in assets, +32 ETFs, and +6 issuers.
- Additionally, this would have been the best performing month in assets in all of 2022. October 2022 was up 6.99%.
- From our 11 asset class categories, Geared/Swaps increased the most (16.1%) with Preferred Stock next (10.0%). Volatility had the worst performance (-12.4%) with Managed Futures not far behind (-5.89%). The two largest asset classes of Equity (76.72% of assets) and Fixed Income (18.68%) soared 8.68% and 4.33% respectively.
- ETF expense ratio 12-month revenue increased from $10.99 Billion to $11.74 Billion.
- Revenue from Active ETFs inched up from 12.22% to 12.27%.
- Total assets increased 7.77%, there was an increase of 23 ETFs to total US ETF count (3,033), and 0 additional issuers by brand.
- January had incredible asset performance, bringing total assets back above $7 Trillion for the first time since early April 2022. Slight slowdown on issuers and ETFs, but not too outside of the mean.
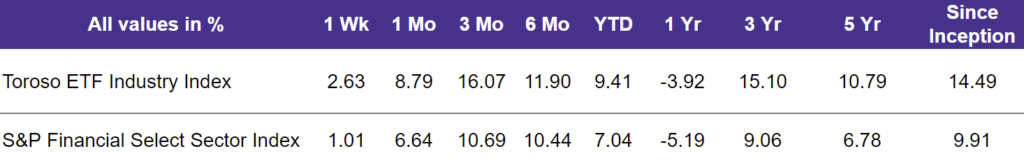
- The tracked indexes had similar experiences in January. The Toroso ETF Industry Index was up 9.41% YTD while the S&P Financial Select Sector Index trailed at 7.04% YTD.
ETF Launches
Strive Emerging Markets Ex-China ETF (ticker: STXE)
First Trust Multi-Strategy Alternative ETF (ticker: LALT)
iShares ESG Aware MSCI USA Growth ETF (ticker: EGUS)
iShares ESG Aware MSCI USA Value ETF (ticker: EVUS)
AllianzIM U.S. Large Cap Buffer10 February ETF (ticker: FEBT)
AllianzIM U.S. Large Cap Buffer20 February ETF (ticker: FEBW)
ASYMmetric Smart Alpha S&P 500 ETF (ticker: ZSPY)
ASYMmetric Smart Income ETF (ticker: MORE)
Calvert International Responsible Index ETF (ticker: CVIE)
Calvert US Large-Cap Core Responsible Index ETF (ticker: CVLC)
Calvert US Large-Cap Diversity, Equity and Inclusion Index ETF (ticker: CDEI)
Calvert US Mid-Cap Core Responsible Index ETF (ticker: CVMC)
Calvert US Select Equity ETF (ticker: CVSE)
Sprott Energy Transition Materials ETF (ticker: SETM)
Sprott Junior Copper Miners ETF (ticker: COPJ)
Sprott Junior Uranium Miners ETF (ticker: URNJ)
Sprott Lithium Miners ETF (ticker: LITP)
Cboe Vest 10 Year Interest Rate Hedge ETF (ticker: RYSE)
Calvert Ultra-Short Investment Grade ETF (ticker: CVSB)
ETF Closures
IQ Hedge Macro Tracker ETF (ticker: MCRO)
IQ Hedge Market Neutral Tracker ETF (ticker: QMN)
IQ Hedge Long/Short Tracker ETF (ticker: QLS)
IQ Hedge Event-Driven Tracker ETF (ticker: QED)
IQ S&P High Yield Low Volatility Bond ETF (ticker: HYLV)
Volt Crypto Industry and Equity ETF (ticker: BTCR)
Fund/Ticker Changes
JPMorgan Corporate Bond Research Enhanced ETF (ticker: JIGB)
became JPMorgan BetaBuilders USD Investment Grade Corporate Bond ETF (ticker: BBCB)
JPMorgan US Aggregate Bond ETF (ticker: JAGG)
became JPMorgan BetaBuilders U.S. Aggregate Bond ETF (ticker: BBAG)
JPMorgan High Yield Research Enhanced ETF (ticker: JPHY)
became JPMorgan BetaBuilders USD High Yield Corporate Bond ETF (ticker: BBHY)
Kinetics Alternative Income Mutual Fund (ticker: KWINX)
became Horizon Kinetics SPAC Active ETF (ticker: SPAQ)
Kinetics Medical Mutual Fund (ticker: MEDRX)
became Horizon Kinetics Medical ETF (ticker: MEDX)
TETF.Index Performance vs. S&P Financial Select Sector Index
(as of February 3, 2023)
TETF.Index Performance vs. Other Leading Financial Indices
(March 31, 2017 through February 3, 2023)
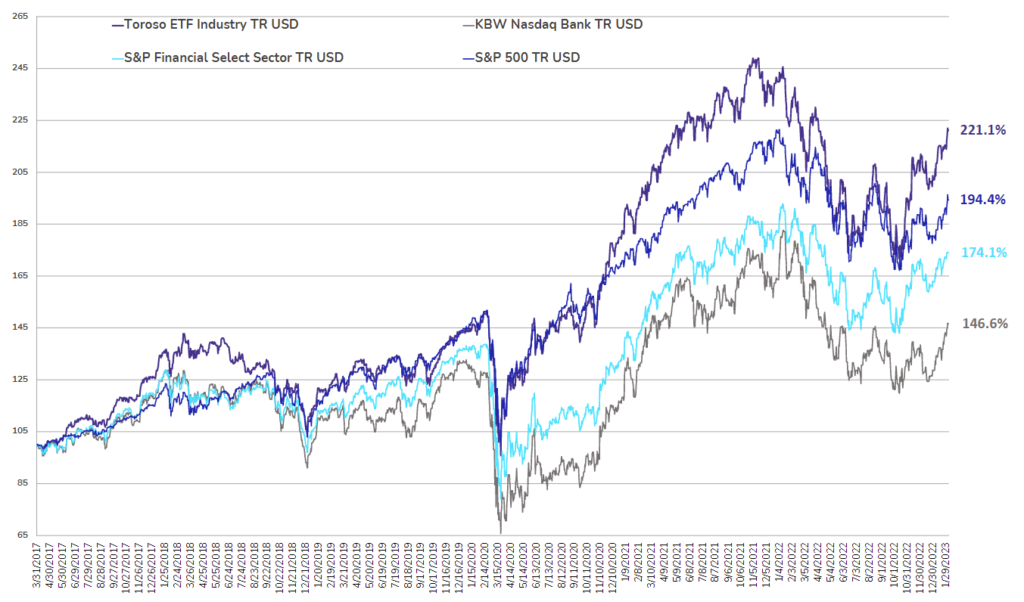
Source: Morningstar Direct
Why Follow the ETF Industry KPIs
The team at Toroso Investments began tracking the ETF Industry Key Performance Indicators (KPI’s) in the early 2000’s and have been consistently reporting on, and analyzing these metrics ever since. The table above was the impetus for the creation of the TETF.Index, the index that tracks the ETF industry. Each week, we will share the statistics we believe to be the most useful for identifying industry trends, in addition to the performance of the TEFT.Index.
DISCLAIMER
Past performance is no guarantee of future returns. This article is for informational and educational purposes only; is not intended to constitute legal, tax, accounting or investment advice; and does not constitute an offer to sell or a solicitation of an offer to buy any security or service. Furthermore, the Indexes shown above are not investable. While Toroso has gathered the information presented from sources that it believes to be reliable, Toroso cannot guarantee the accuracy or completeness of the information presented and the information presented should not be relied upon as such. Any opinions expressed are Toroso’s opinions and do not reflect the opinions of any affiliates or related persons. All opinions are current only as of the date of initial publication and are subject to change without notice. All investment strategies and investments involve risk of loss, including the possible loss of all amounts invested.