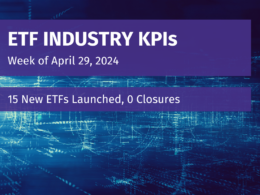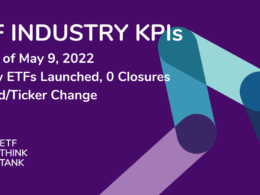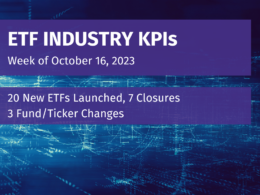
Week of May 30, 2022 KPI Summary
- This week, the industry experienced 2 ETF launches and no closures, shifting the 1-year Open-to-Close ratio to 4.80 and total US ETFs to 2,942.
- Today, let’s take a look at a few KPIs surrounding the funds launched in the past 12-months.
- There have been 474 funds launched in the past 12-months that are currently open.
- 156 issuers launched at least one of these funds. Nine issuers averaged at least one launch per month (12+). Innovator led all issuers with 18 funds, but Dimensional’s 14 funds had the most AUM with approximately $4.1 Billion.
- The top 5 issuers in AUM (totaling 49 funds launched) compiled 46.6% of the AUM in the last 12-months.
- 84 of the 156 issuers launched only 1 fund.
- 265 of the 474 funds launched are categorized as Equity (55.9%), and coincidently Equity represents 56.7% of the total AUM ($27.1 Billion). On the other hand, there are 81 Fixed income funds (17.1%) summing 20.4% of the total AUM.
- These percentages are close to the overall industry for Equity/Fixed Income with the exception of Equity AUM. Equity’s total assets make up 76.8% of the ETF industry, meanwhile 56.7% of its funds launched in the last 12-months (-20.1%).
- Commodities Physical had the highest AUM per fund with 2 funds totaling 4.2% of the total AUM.
- The tracked indexes had similar experiences in the past week. The Toroso ETF Industry Index was down 2.15% while the S&P Financial Select Sector Index led at -2.05%.

ETF Launches
Direxion Breakfast Commodities Strategy ETF (ticker: BRKY)
Procure Disaster Recovery Strategy ETF (ticker: FEMA)
ETF Closures
None
Fund/Ticker Changes
None
TETF.Index Performance vs. S&P Financial Select Sector Index
(as of June 3, 2022)

TETF.Index Performance vs. Other Leading Financial Indices
(March 31, 2017 through June 3, 2022)

Source: Morningstar Direct
Why Follow the ETF Industry KPIs
The team at Toroso Investments began tracking the ETF Industry Key Performance Indicators (KPI’s) in the early 2000’s and have been consistently reporting on, and analyzing these metrics ever since. The table above was the impetus for the creation of the TETF.Index, the index that tracks the ETF industry. Each week, we will share the statistics we believe to be the most useful for identifying industry trends, in addition to the performance of the TEFT.Index.
DISCLAIMER
Past performance is no guarantee of future returns. This article is for informational and educational purposes only; is not intended to constitute legal, tax, accounting or investment advice; and does not constitute an offer to sell or a solicitation of an offer to buy any security or service. Furthermore, the Indexes shown above are not investable. While Toroso has gathered the information presented from sources that it believes to be reliable, Toroso cannot guarantee the accuracy or completeness of the information presented and the information presented should not be relied upon as such. Any opinions expressed are Toroso’s opinions and do not reflect the opinions of any affiliates or related persons. All opinions are current only as of the date of initial publication and are subject to change without notice. All investment strategies and investments involve risk of loss, including the possible loss of all amounts invested.