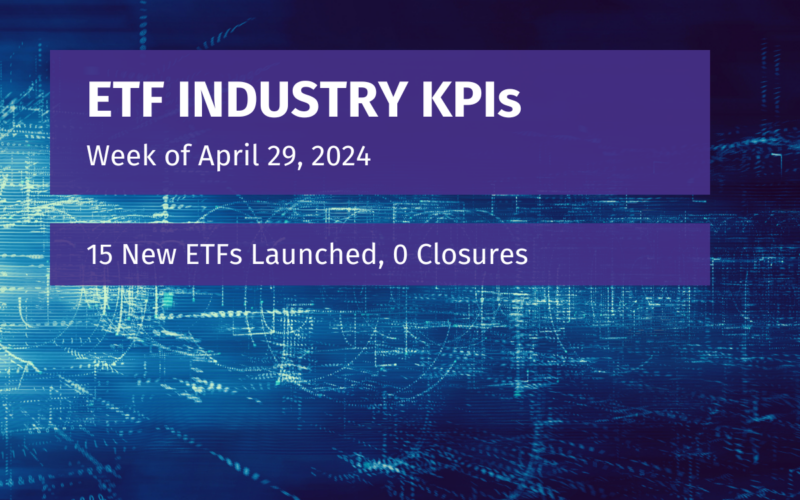
Week of April 29, 2024 KPI Summary
 Ryan Fitzgerald
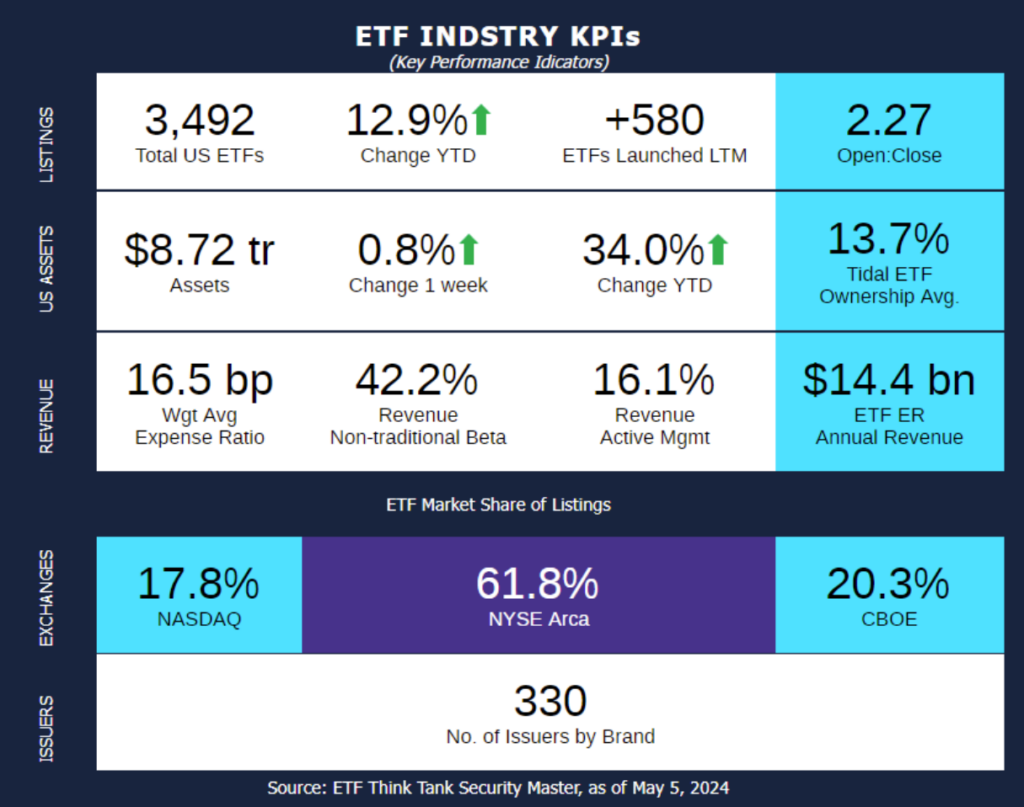
- This week, the industry experienced 15 ETF launches and 0 closures, shifting the 1-year Open-to-Close ratio to 2.27 and total US ETFs to 3,492.
- 2024 ETF GRADUATION: For millions of high school and college students across the United States, May means graduation! Most students take 4 years to graduate, so we are going to examine the top ETFs that were launched in 2020.
- 257 ETFs are still open that were launched in 2020, totaling $216.2 Billion which is about 2.5% of the ETF industry total AUM.
- Equity ETFs make up 50% of the funds (128) yet 45% of the AUM. Additionally, Fixed Income is 20% of the funds but 47% of the AUM.
- The only $1B+ fund outside of Equities and Fixed Income funds is BUFR, First Trust Cboe Vest Fund of Buffer ETFs; an Options fund at $3.97 Billion.
- The largest fund by AUM of 2020 is currently Vanguard US Trsry 0-1 Yr Bd ETF MXN HAXX (VMSTx) at approximately $43.1 Billion. The next 4 in order are JEPI, QQQM, SGOV, & JAAA. These 5 funds make up $128.6B, approximately 59.5% of total 2020 ETF AUM.
- Worth noting that in the top 10: Dimensional has 3 funds, iShares has 2, and 5 other issuers each have 1.
- iShares has the most 2020 ETFs still live at 35 funds.
- Worth noting that in the top 10: Dimensional has 3 funds, iShares has 2, and 5 other issuers each have 1.
- The fund with the best 3-year asset performance (many 4-year outlooks are incomplete) is ETRACS Quarterly Pay 1.5X Leveraged Alerian MLP Index ETN (MLPR) at 32.4%.
- In fact, UBS ETRACS funds constitute 4 of the top 5 3-year performers, ranging from 14-32% growth.
- Of the 148 Actively Managed ETFs:
- JPMorgan Equity Premium Income ETF (JEPI) is the largest at $33B.
- Fidelity® Fundamental Large Cap Core ETF (FFLC) has the top 3-year performance at 13.7%.
- Lastly, who had the best final semester of their senior year? The top performer YTD has been (by far) AdvisorShares Pure US Cannabis ETF (MSOS) at 38.9%, with the next best at 18.2% (WUGI).
- 257 ETFs are still open that were launched in 2020, totaling $216.2 Billion which is about 2.5% of the ETF industry total AUM.
- Congratulations to all the 257 ETFs graduating this year, especially the ones graduating with honors mentioned above! Our graduating class is a bit bigger than last year (187), but over 3x larger in terms of assets (~$216B to $70B). Good luck to this “COVID Class” going forward!
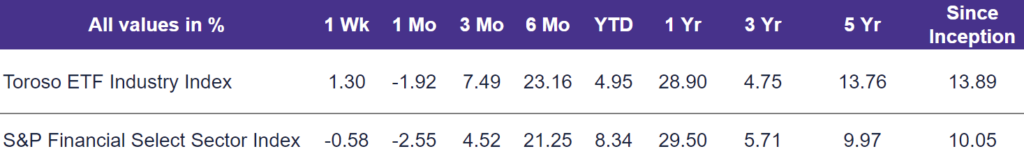
- The tracked indexes had similar experiences in the last few years. Over a 3-year period, The Toroso ETF Industry Index is up 4.75% while the S&P Financial Select Sector Index led at 5.71%.
ETF Launches
Harbor Disciplined Bond ETF (ticker: AGGS)
Themes Silver Miners ETF (ticker: AGMI)
Calamos S&P 500 Stuructured Alt Protection ETF – May (ticker: CPSM)
YieldMax Short TSLA Option Income Strategy ETF (ticker: CRSH)
TrueShares Active Yield ETF (ticker: ERNZ)
Innovator International Developed Power Buffer ETF – May (ticker: IMAY)
John Hancock High Yield ETF (ticker: JHHY)
PGIM US Large-Cap Buffer 12 ETF – May (ticker: MAYP)
AllianzIM US Equity Buffer15 Uncapped May ETF (ticker: MAYU)
PGIM US Large-Cap Buffer 20 ETF – May (ticker: PBMY)
PeakShares Sector Rotation ETF (ticker: PSTR)
First Trust Bloomberg R&D Leaders ETF (ticker: RND)
AllianzIM US Large Cap 6 Month Buffer10 May/Nov ETF (ticker: SIXZ)
Tremblant Global ETF (ticker: TOGA)
Westwood Salient Enhanced Energy Income ETF (ticker: WEEI)
ETF Closures
None
Fund/Ticker Changes
None
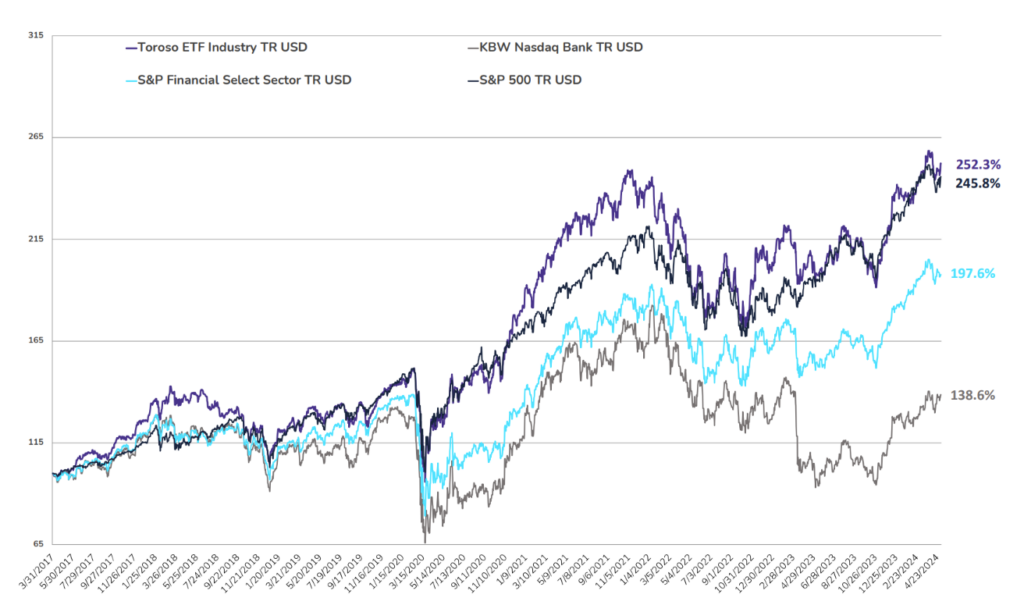
TETF.Index Performance vs. S&P Financial Select Sector Index
(as of May 3, 2024)
TETF.Index Performance vs. Other Leading Financial Indices
(March 31, 2017 through May 3, 2024)
Why Follow the ETF Industry KPIs
The team at Tidal Investments, originally operating as Toroso Investments, began tracking the ETF Industry Key Performance Indicators (KPIs) in the early 2000s and have been consistently reporting on, and analyzing these metrics ever since. This diligent tracking was the catalyst for the creation of the TETF.Index, an index that tracks the ETF industry. Now, as part of the Tidal Financial Group, which is affiliated with Tidal Investments, LLC, we are positioned to provide even more in-depth analysis and insights. Each week, we will share the statistics we believe to be the most useful for identifying industry trends, in addition to the performance of the TETF.Index.
DISCLAIMER
Past performance is no guarantee of future returns. This article is for informational and educational purposes only; is not intended to constitute legal, tax, accounting, or investment advice; and does not constitute an offer to sell or a solicitation of an offer to buy any security or service. Furthermore, the Indexes shown above are not investable. While Tidal Investments, LLC (formerly known as Toroso Investments, LLC) has gathered the information presented from sources that it believes to be reliable, Tidal Investments, LLC cannot guarantee the accuracy or completeness of the information presented and the information presented should not be relied upon as such. Any opinions expressed are Tidal Investments, LLC’s opinions and do not reflect the opinions of any affiliates or related persons. All opinions are current only as of the date of initial publication and are subject to change without notice. All investment strategies and investments involve risk of loss, including the possible loss of all amounts invested.