INDEX PERFORMANCE DATA
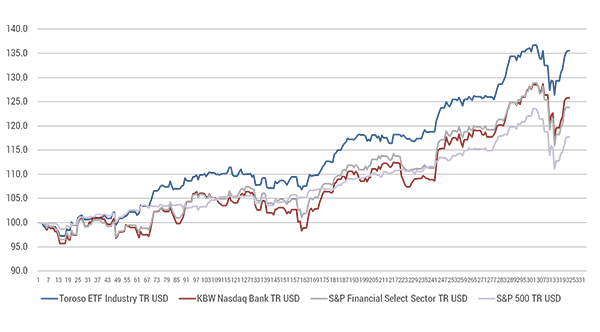
| 2/02/2018 | 1 Wk | 1 Mo | 3 Mo | 6 Mo | 1 Yr | QTD | YTD | Since Inception |
|---|---|---|---|---|---|---|---|---|
| Toroso ETF Industry Index | 4.75% | 1.43% | 15.45% | 24.04% | 7.57% | 7.57% | 35.49% | |
| S&P Financial Select Sector Index | 4.73% | (0.52)% | 11.27% | 16.85% | 20.51% | 3.84% | 3.84% | 23.75% |
HAVE ACTIVE ETFs ENTERED THE FEE WAR?
Last week, Vanguard entered the world of actively managed ETFs with the launch of 6 ETFS. This begs the question if the “fee wars” have now spread to active ETFs. In this week’s TETFindex update, we will explore the revenue generated by the expense ratios charged by the ETF industry. That said, in the previous issue, we explored other interesting ways issuers have maintained and improved margins while aligning with clients through ETFs.
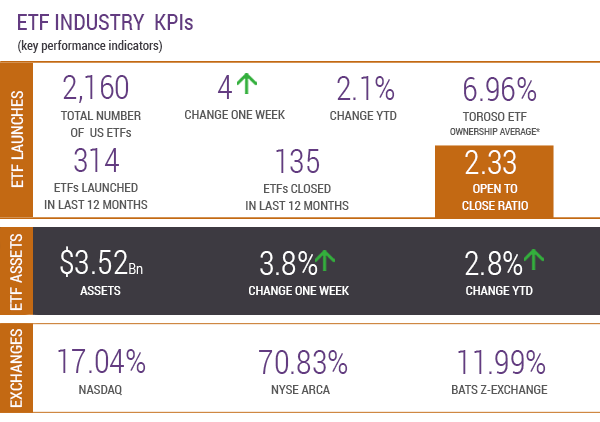
Currently, the average expense ratio of the 2160 US listed ETFs is .43%, but weighted for assets the average decreases to .22%. This shows that most investors gravitate to the ETF client alignment factor of low cost. At .22%, the implied forward-looking revenue generated by ETF fees is estimated at $7.4 billion per year. The direct revenue growth is increasing in line with the growth of assets.
Considering the bold moves by Vanguard, we decided to look at the expense ratio break down by investment approach:
EXPENSE RATIO BY INVESTMENT APPROACH
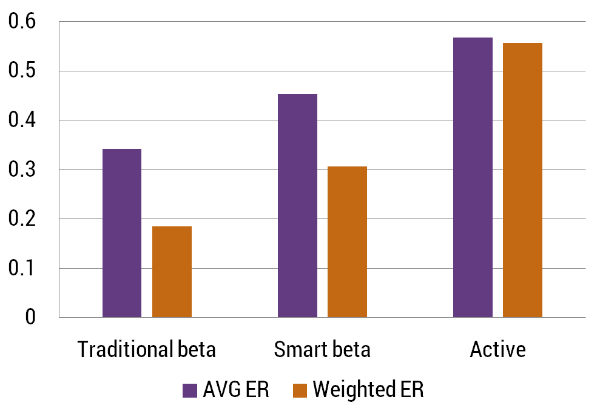
As expected, Traditional beta is the cheapest offering and Active is the most expensive.
EXPENSE RATIO BY ASSET CLASS
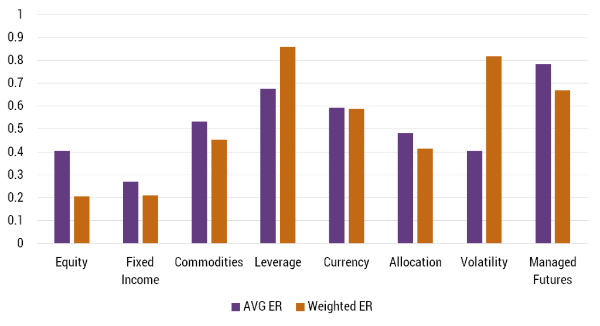
Not surprisingly, Equity and Fixed income are the cheapest on a weighted average since they are the easiest asset classes to replicate. What stands out is that the Leverage and Volatility weighted averages are actually higher than the absolute average. This implies that investors are more interested in liquidity than expenses when it comes to trading vehicles.
EXPENSE RATIO BY GEOGRAPHIC FOCUS
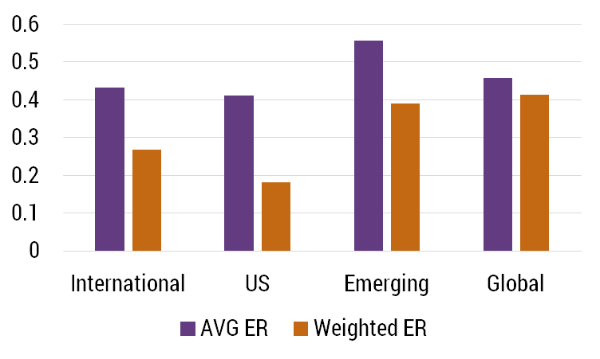
When evaluating ETF’s expense ratio by geography, we see again that the easiest asset classes to replicate are the least expensive, US ETFs in this case. There is an interesting phenomenon with Global ETFs where the average and weighted are quite similar, which is probably associated with the Global thematic ETFs.
EXPENSE RATIO BY SECTOR
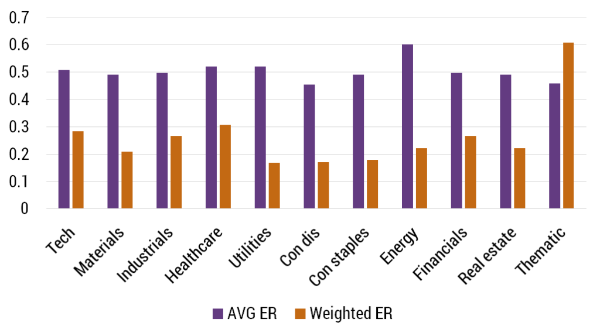
Very surprising that people are over-spending for Thematic ETFs due to liquidity and their ability to capture trends. In terms of traditional sectors, it appears that the average expense ratio for Energy is the highest, but on a weighted basis, Utilities seem to offer the best bargain.
ETF LAUNCHES
| Portfolio+ S&P® Mid Cap ETF | PPMC 2/15/2019 |
| Portfolio+ Emerging Markets ETF | PPEM 2/15/2019 |
| Portfolio+ Developed Markets ETF | PPDM 2/15/2019 |
| Portfolio+ Total Bond Market ETF | PPTB 2/15/2019 |
| Vanguard US Multifactor ETF | VFMF 2/14/2019 |
| Vanguard US Quality Factor ETF | VFQY 2/14/2019 |
| Vanguard US Value Factor ETF | VFVA 2/14/2019 |
| Vanguard US Liquidity Factor ETF | VFLQ 2/14/2019 |
| Vanguard US Minimum Volatility ETF | VFMV 2/14/2019 |
| Vanguard US Momentum Factor ETF | VFMO 2/14/2019 |
| Horizons Cadence Hedged US Div Yld ETF | USDY 2/13/2019 |
| Innovation Shares NextGen Vhcl andTchETF | EKAR 2/9/2019 |
ETF LAUNCH OF THE WEEK:
PPEM, Portfolio+ Emerging Markets ETF, is an interesting way of getting precise, enhanced exposure to the emerging markets. We covered this structural factor in a report we wrote on PPLC.
TETF INDEX PERFORMANCE Vs. LEADING FINANCIAL INDEXES
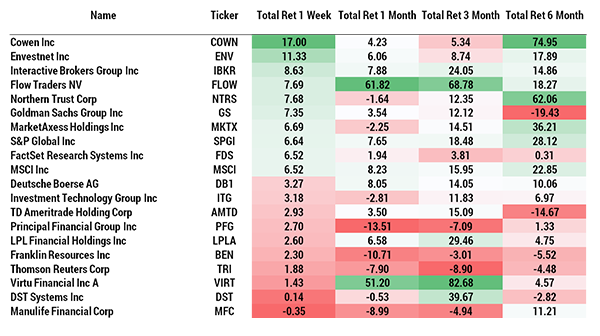
TETF INDEX UNDERLYING TOP/BOTTOM 10 HOLDINGS PERFORMANCE
