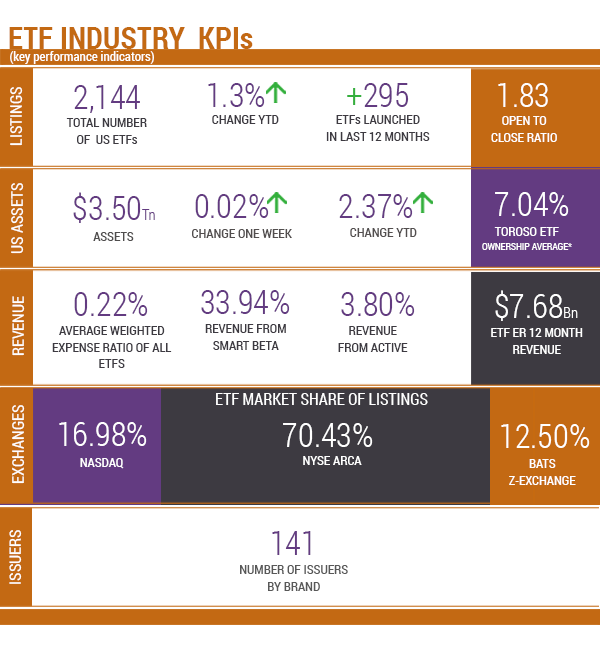
Source of KPIs: Toroso Investments Security Master, as of April 30, 2018
INDEX PERFORMANCE DATA

Returns as of April 30, 2018.
Inception Date: April 4, 2017. Index performance is for informational purposes only and does not represent the ETF.
Indexes are unmanaged and one cannot invest directly in an index.
Past performance is NOT indicative of future results, which can vary.
EWW, MEXICO WINS THE ETF WAR
This Saturday is May 5th, the Mexican holiday Cinco de Mayo. While it is a relatively minor holiday in Mexico, Cinco de Mayo has evolved into a commemoration of Mexican culture and heritage in the US, particularly in areas with large Mexican-American populations. Surprising to most Americans, Cinco de Mayo is not Mexico’s Independence Day like our Fourth of July. The holiday celebrates the Mexican army’s 1862 victory over France at the Battle of Puebla during the Franco-Mexican War. Sticking with our holiday theme lately, we want to take a closer look at the five ETFs focused on Mexico and the two ETFs focused on France.
EWW- iShares MSCI Mexico Capped ETF
EWW provides broad exposure to the Mexican stock market. Since the Mexican market is very top heavy, EWW reconfigures market cap weightings slightly to stay RIC-compliant. It’s worth noting that EWW has almost no technology, energy or utilities stocks, as the companies in these sectors are privately owned or run by the government. It’s top three sectors in order are Financials, Consumer Non-Cyclicals, and Telecommunications.
EWW has $1.24 Billion in AUM, an expense ratio of 0.49% and average daily volume of 3,908,900 shares. Fun Fact: EWW is tied for the 3rd oldest surviving ETF (issued 3/12/1996) and was the best performing ETF of all-time up until 2007.
MEXX- Direxion Daily MSCI Mexico Bull 3X Shares
The Direxion Daily MSCI Mexico Bull 3X Shares (MEXX) offers daily leveraged 3X exposure to a broad, market- cap-weighted index of Mexican firms. It is the only ETF on this list that is a Smart Beta, Leverage ETF.
MEXX has $16.6 Million in AUM, an expense ratio of 0.95%, 647% turnover ratio (15 thhighest of all ETFs) and average daily volume of 9,360 shares. Fun Fact: Oddly enough, it’s 1 year anniversary is this Thursday, May 3 rd!
Here are the other three Mexico-focused ETFs and their AUM
Franklin FTSE Mexico ETF FLMX
AUM of $2,564,092
iShares Currency Hedged MSCI Mexico ETF HEWW
AUM of $1,973,019
Xtrackers MSCI Mexico Hedged Equity ETF DBMX
AUM of $963,294
Now on the French side, there are only two ETFs: EWQ and FLFR.
EWQ- iShares MSCI France ETF
EWQ is the best pure play for exposure to the French market. It is the French version of EWW, though not as large asset-wise. The iShares MSCI France Index Fund tracks a market-cap-weighted index of French companies and covers the top 85% of French companies by market cap. EWQ holds a diverse portfolio of French large and mid-caps with an exceptionally market-like array of sector weights. It’s top three sectors are Industrials, Consumer Cyclicals, and Financials in that order.
It has $875 Million in AUM, an expense ratio of 0.49%, and average trading volume of 1,083,314 shares. Fun Fact: Other than having the same inception date as EWW and 16 other iShares MSCI products, EWQ is the tenth largest in AUM of that group. In fact, EWJ (iShares MSCI Japan ETF) is the largest and has more AUM than the next 16 combined (approximately 21 million).
Franklin FTSE France ETF FLFR
The other France focused ETF is a new comer from Franklin with only $2.64 Million of AUM. This is part of Franklin’s approach to entering the ETF industry through low cost alternatives and embrace the client alignment growth factors.
EWW vs EWQ
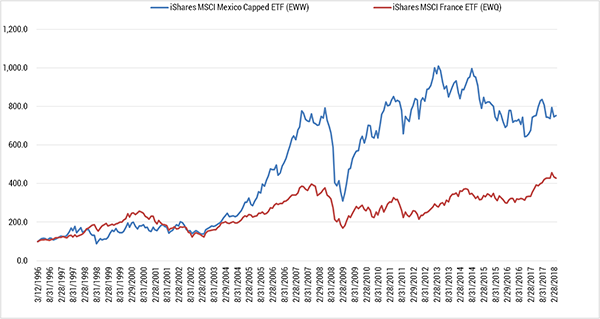
As stated before, EWW was arguably the best performing ETF of all-time from its inception in 1996 until 2007.
Just like in 1862, it appears Mexico has defeated France in the ETF war in terms of assets, products and performance. It was an innovation at the time, and, as always, we aim to portray the growth and advancement of the ETF Industry’s present and future through the TETF.index.
ETF LAUNCHES
| Hartford Schroders Tax-Aware Bond ETF | HTAB |
| Principal Investment Grd Corp Actv ETF | IG |
TETF INDEX PERFORMANCE VS LEADING FINANCIAL INDEXES
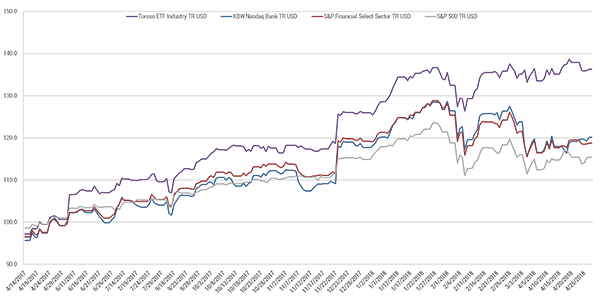
Returns as of April 30, 2018.
Inception Date: April 4, 2017. Index performance is for informational purposes only and does not represent the ETF.
Indexes are unmanaged and one cannot invest directly in an index.
Past performance is NOT indicative of future results, which can vary.
TOP 10 HOLDINGS PERFORMANCE

BOTTOM 10 HOLDINGS PERFORMANCE


