
Week of May 20, 2024 KPI Summary
 Ryan Fitzgerald
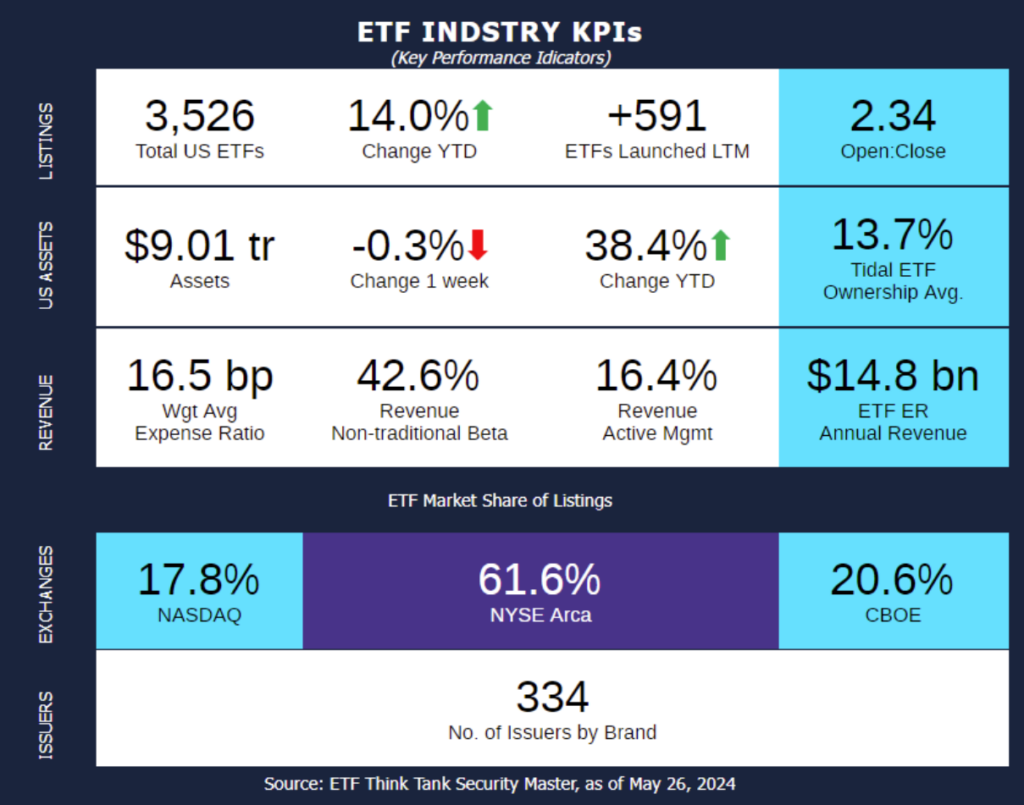
- This week, the industry experienced 15 ETF launches and 0 closures, shifting the 1-year Open-to-Close ratio to 2.34 and total US ETFs to 3,526.
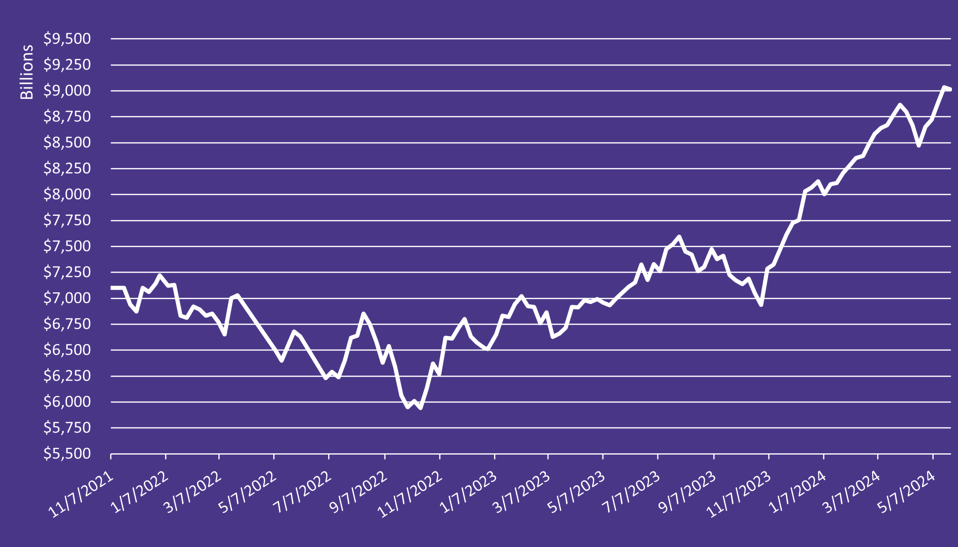
- US ETF Assets have crossed 9 Trillion Dollars and here’s why it’s interesting!
- While it took 110 weeks to go from $7 Trillion in November 2021 to $8 Trillion in December 2023, it’s only taken 22 weeks to reach the next one trillion milestone. That’s one fifth of the time and an average of $45 Billion per week.
- Since October 16, 2022, assets have increased $3.07 Trillion in the ~19 month span.
- From 8 to $9 Trillion, the largest week-to-week change was only 2.13%, which contributed to the 4/21/24 to 5/19/24 increase of $562 Billion over a mere 4 week period.
- This is the largest jump we have seen since November last year ($677 Billion).
- Industry Assets have more than doubled since May 31, 2020, 4 years ago, from $4.23 to $9.01 Trillion today.
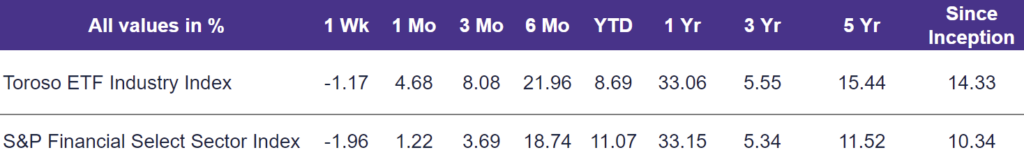
- The tracked indexes experienced similar down performance last week. The Toroso ETF Industry Index was down -1.17% while the S&P Financial Select Sector Index trailed at -1.96%.
Total US ETF Assets
ETF Launches
Amplify Weight Loss Drug & Treatment ETF (ticker: THNR)
FT Vest Nasdaq-100 Moderate Buffer ETF – May (ticker: QMMY)
FT Vest US Equity Enhance & Moderate Buffer ETF – May (ticker: XMAY)
Genter Capital Municipal Quality Intermediate ETF (ticker: GENM)
Genter Capital Taxable Quality Intermediate ETF (ticker: GENT)
iShares iBonds 2031 Term High Yield and Income ETF (ticker: IBHK)
iShares iBonds Dec 2030 Term Muni Bond ETF (ticker: IBMS)
iShares iBonds Dec 2034 Term Corporate ETF (ticker: IBDZ)
iShares iBonds Oct 2034 Term TIPS ETF (ticker: IBIK)
Otter Creek Focus Strategy ETF (ticker: OCFS)
PGIM US Large-Cap Buffer 12 ETF – November (ticker: NOVP)
PGIM US Large-Cap Buffer 20 ETF – November (ticker: PBNV)
Roundhill GLP-1 & Weight Loss ETF (ticker: OZEM)
SPDR Portfolio Treasury ETF (ticker: SPTB)
YieldMax Gold Miners Option Income Strategy ETF (ticker: GDXY)
ETF Closures
None
Fund/Ticker Changes
None
TETF.Index Performance vs. S&P Financial Select Sector Index
(as of May 24, 2024)
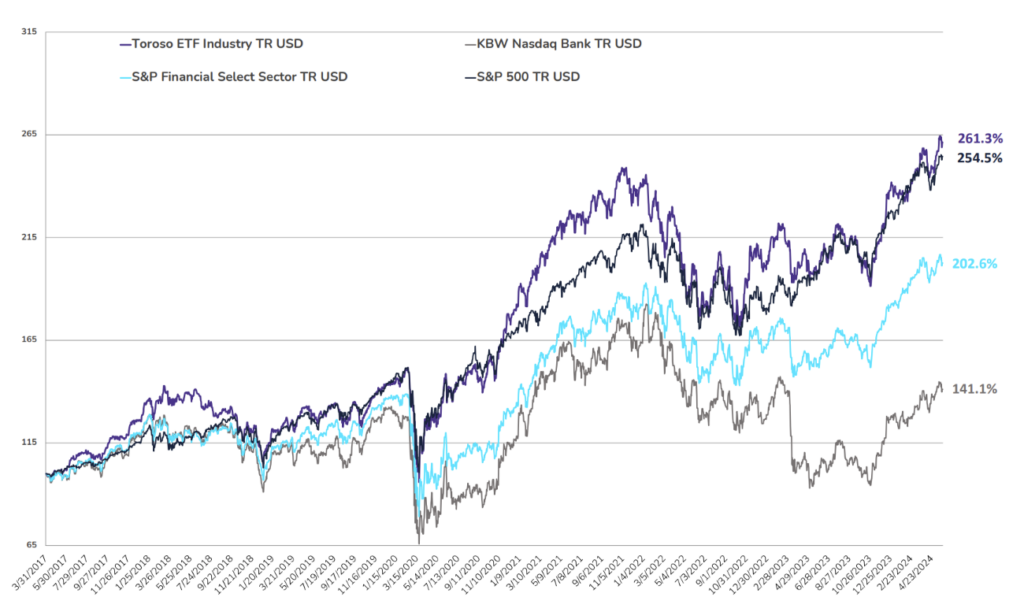
TETF.Index Performance vs. Other Leading Financial Indices
(March 31, 2017 through May 24, 2024)
Why Follow the ETF Industry KPIs
The team at Tidal Investments, originally operating as Toroso Investments, began tracking the ETF Industry Key Performance Indicators (KPIs) in the early 2000s and have been consistently reporting on, and analyzing these metrics ever since. This diligent tracking was the catalyst for the creation of the TETF.Index, an index that tracks the ETF industry. Now, as part of the Tidal Financial Group, which is affiliated with Tidal Investments, LLC, we are positioned to provide even more in-depth analysis and insights. Each week, we will share the statistics we believe to be the most useful for identifying industry trends, in addition to the performance of the TETF.Index.
DISCLAIMER
Past performance is no guarantee of future returns. This article is for informational and educational purposes only; is not intended to constitute legal, tax, accounting, or investment advice; and does not constitute an offer to sell or a solicitation of an offer to buy any security or service. Furthermore, the Indexes shown above are not investable. While Tidal Investments, LLC (formerly known as Toroso Investments, LLC) has gathered the information presented from sources that it believes to be reliable, Tidal Investments, LLC cannot guarantee the accuracy or completeness of the information presented and the information presented should not be relied upon as such. Any opinions expressed are Tidal Investments, LLC’s opinions and do not reflect the opinions of any affiliates or related persons. All opinions are current only as of the date of initial publication and are subject to change without notice. All investment strategies and investments involve risk of loss, including the possible loss of all amounts invested.