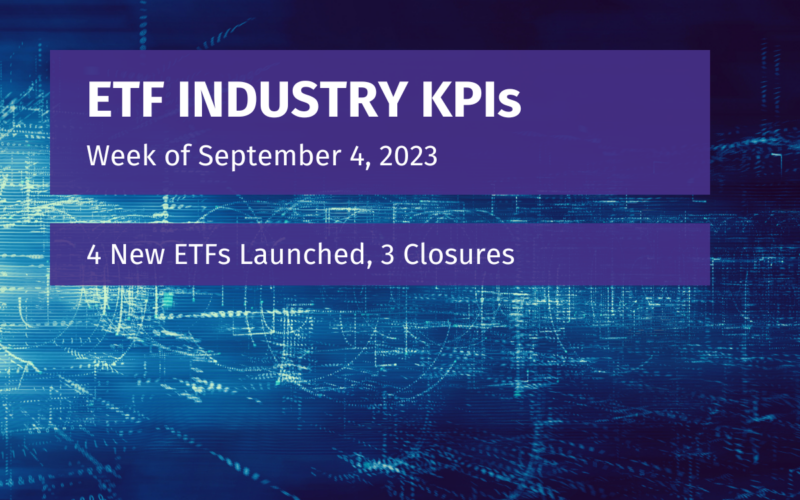
Week of September 4, 2023 KPI Summary
 Ryan Fitzgerald
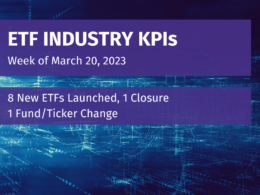
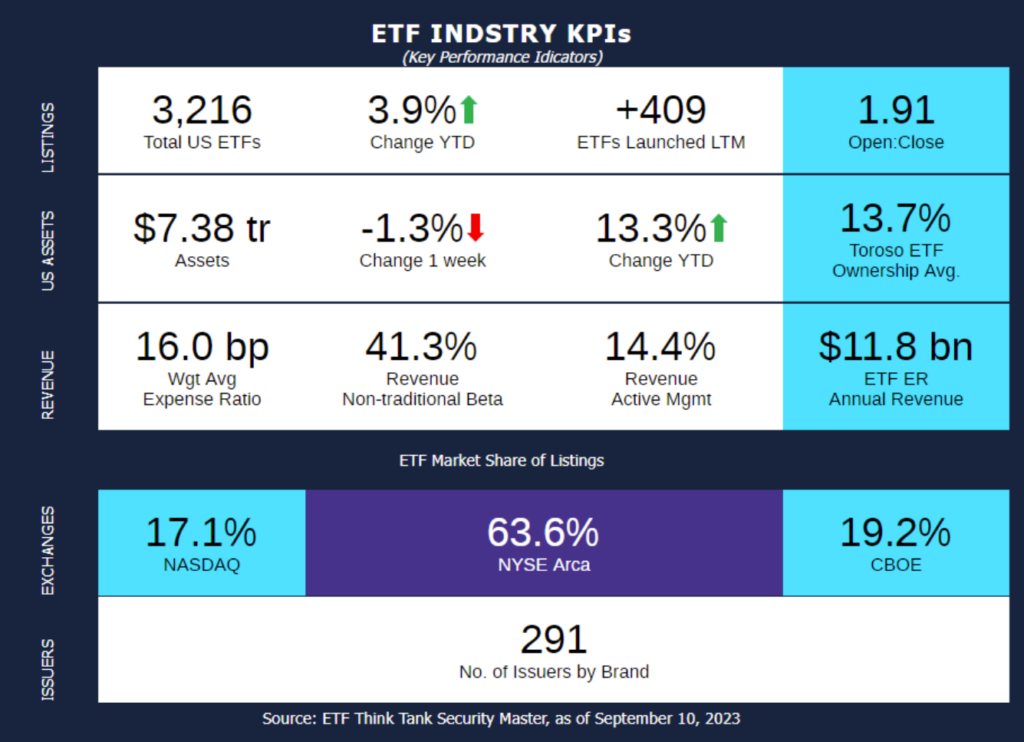
- This week, the industry experienced 4 ETF launches and 3 closures, shifting the 1-year Open-to-Close ratio to 1.91 and total US ETFs to 3,216.
- Let’s check in on the Exchanges and see how each of the big 3 have fared in 2023 thus far.
- In assets, CBOE has had the best performance with 16.0% YTD, followed by Nasdaq at 14.5%, and lastly NYSE at 12.6% YTD.
- NYSE constitutes 74.86% of total assets from these 3 Exchanges but has lost 0.38% YTD market share to CBOE and Nasdaq.
- In terms of listings, NYSE has increased the most at 51 funds (2.6% increase to 2,046 total).
- At this time last year, NYSE total funds had increased +104.
- Although CBOE has only 41% of the Nasdaq fund assets, it now has 69 more listings according to our Security Master.
- Since September 13, 2020, Nasdaq total listings have increased +146 and CBOE up +245.
- In assets, CBOE has had the best performance with 16.0% YTD, followed by Nasdaq at 14.5%, and lastly NYSE at 12.6% YTD.
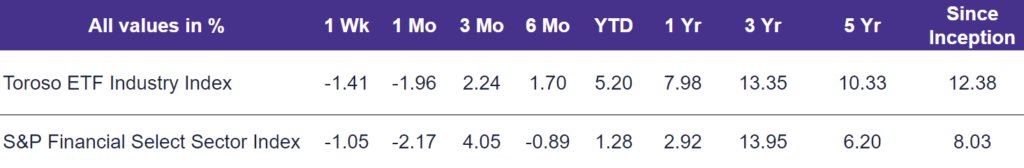
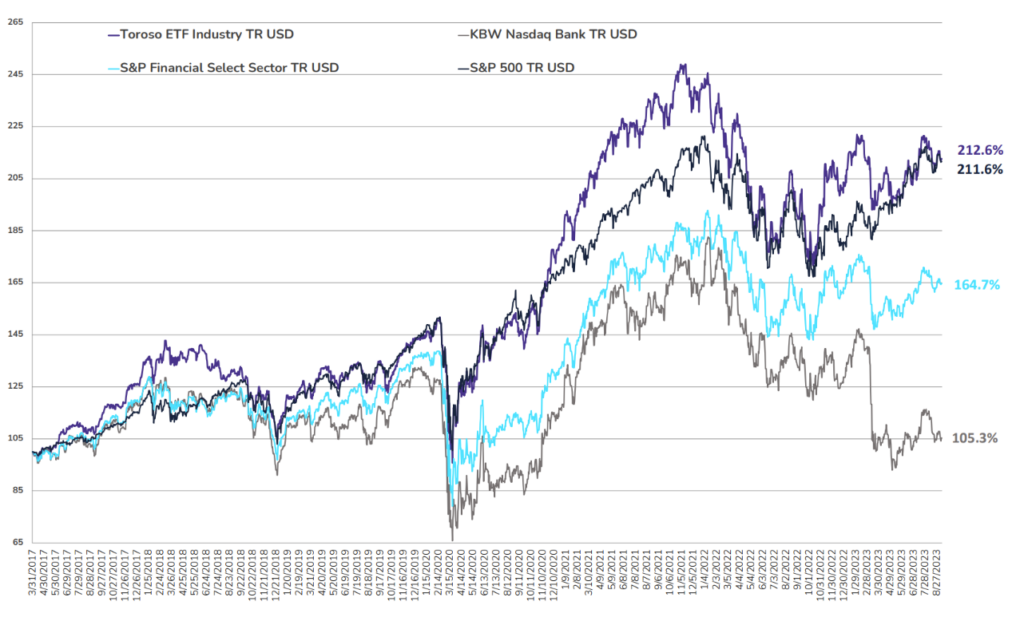
- The tracked indexes had similar experiences last week. The Toroso ETF Industry Index was down -1.41% while the S&P Financial Select Sector Index led at -1.05%.
ETF Launches
KraneShares Global Luxury Index ETF (ticker: KLXY)
Madison Short-Term Strategic Income ETF (ticker: MSTI)
Return Stacked® US Stocks & Managed Futures ETF (ticker: RSST)
F/m Opportunistic Income ETF (ticker: XFIX)
ETF Closures
Asian Growth Cubs ETF (ticker: CUBS)
Strategy Shares Nasdaq 5 Handl™ ETF (ticker: FIVR)
AdvisorShares Poseidon Dynamic Cannabis ETF (ticker: PSDN)
Fund/Ticker Changes
None
TETF.Index Performance vs. S&P Financial Select Sector Index
(as of September 8, 2023)
TETF.Index Performance vs. Other Leading Financial Indices
(March 31, 2017 through September 8, 2023)
Why Follow the ETF Industry KPIs
The team at Toroso Investments began tracking the ETF Industry Key Performance Indicators (KPI’s) in the early 2000’s and have been consistently reporting on, and analyzing these metrics ever since. The table above was the impetus for the creation of the TETF.Index, the index that tracks the ETF industry. Each week, we will share the statistics we believe to be the most useful for identifying industry trends, in addition to the performance of the TEFT.Index.
DISCLAIMER
Past performance is no guarantee of future returns. This article is for informational and educational purposes only; is not intended to constitute legal, tax, accounting or investment advice; and does not constitute an offer to sell or a solicitation of an offer to buy any security or service. Furthermore, the Indexes shown above are not investable. While Toroso has gathered the information presented from sources that it believes to be reliable, Toroso cannot guarantee the accuracy or completeness of the information presented and the information presented should not be relied upon as such. Any opinions expressed are Toroso’s opinions and do not reflect the opinions of any affiliates or related persons. All opinions are current only as of the date of initial publication and are subject to change without notice. All investment strategies and investments involve risk of loss, including the possible loss of all amounts invested.