Week of February 26, 2024 KPI Summary
 Ryan Fitzgerald
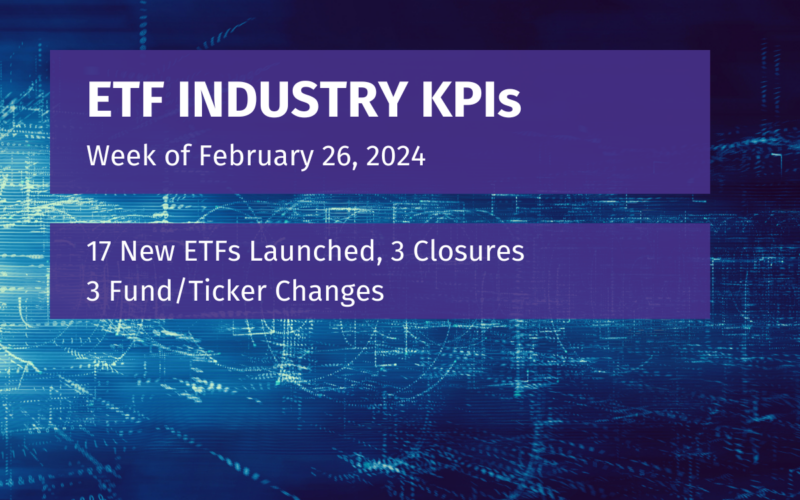
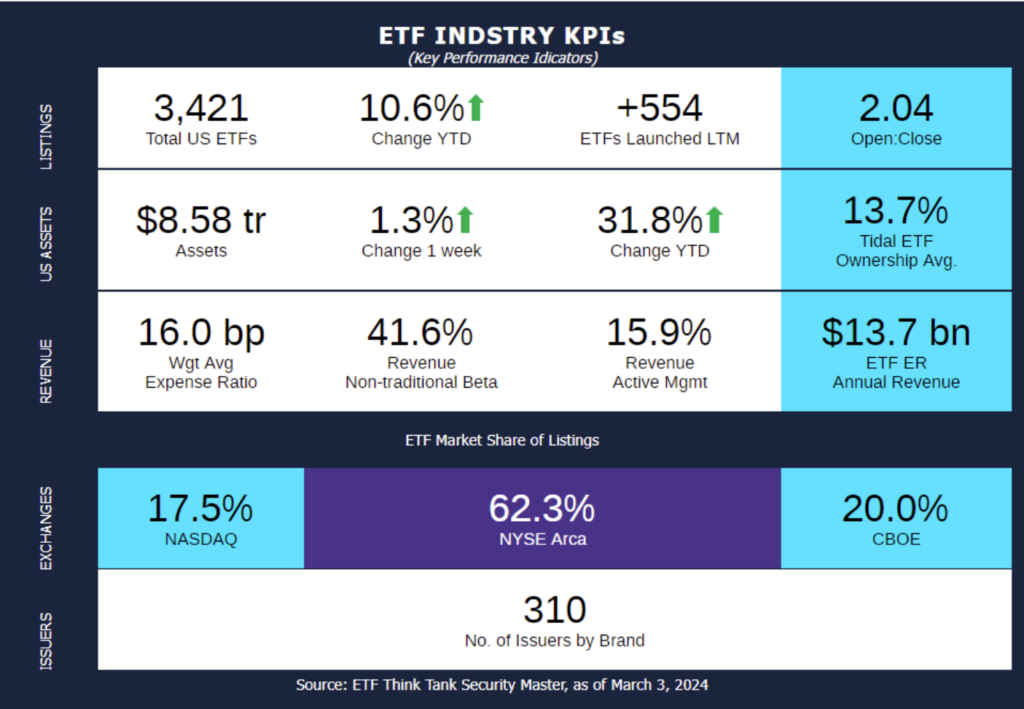
- This week, the industry experienced 17 ETF launches and 3 closures, shifting the 1-year Open-to-Close ratio to 2.04 and total US ETFs to 3,421.
- It’s time for our monthly update to review some notable KPIs from February (data comparing 2/5/24 – 3/4/24).
- Total assets increased 3.7%, there was a change of -10 ETFs to total US ETF count (3,421), and 2 less issuers by brand.
- From our 11 asset class categories, Commodities Physical increased the most (10.9%) with Geared/Swaps next (6.4%). Volatility had the worst performance (-5.2%) with Currency at second worst (-1.8%). The two largest asset classes of Equity (77.2% of assets) and Fixed Income (17.4%) rose 4.3% and 0.03% respectively.
- The ETF expense ratio annual revenue increased from $13.2 Bn to $13.7 Bn.
- February was a positive month for ETF assets, but a time of trimming for funds and issuers. There were 43 closures across the 4 week period and total ETFs dropped by 10. For context, total ETFs haven’t been negative, let alone -10, on our monthly reviews in 2+ years. Also -2 in issuers is the lowest mark during that time period as well.
- On the other hand, this is 4 consecutive months of positive ETF industry AUM, which has been full of streaks in the last 12 months. Starting in March 2023, it’s been 5 months of positive performance, then 3 of negative, and now 4 positive months again. February 2024 is the 3rd highest month over the 12-month period behind November (+11.4%) and December (5.2%).
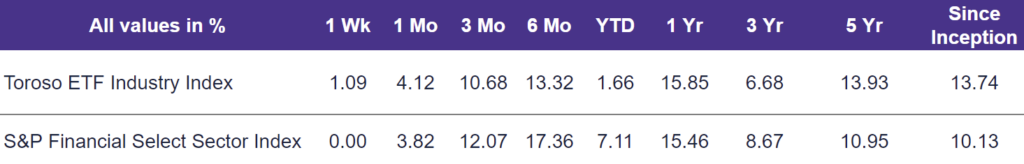
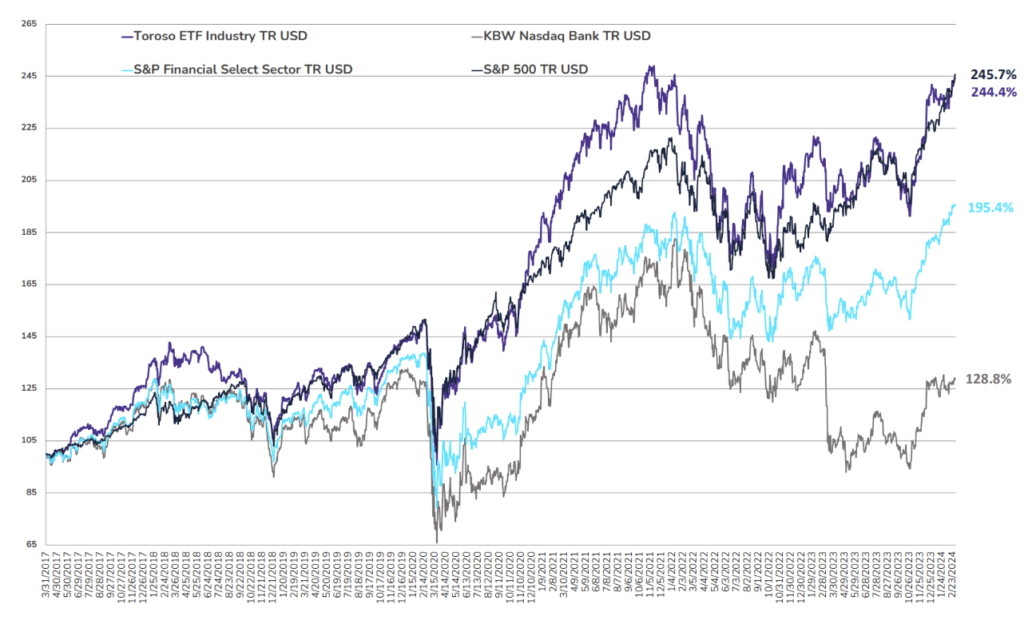
- The tracked indexes had similar experiences in February. The Toroso ETF Industry Index was up 4.12% while the S&P Financial Select Sector Index trailed at 3.82%.
ETF Launches
First Trust Commercial Mortgage Opportunities ETF (ticker: CAAA)
First Trust Structured Credit Income Opportunities ETF (ticker: SCIO)
Fidelity Fundamental Large Cap Value ETF (ticker: FFLV)
Fidelity Low Duration Bond ETF (ticker: FLDB)
SGI Enhanced Global Income ETF (ticker: GINX)
Innovator International Developed Power Buffer ETF – March (ticker: IMAR)
Roundhill Daily Inverse Magnificent Seven ETF (ticker: MAGQ)
Roundhill Daily 2X Long Magnificent Seven ETF (ticker: MAGX)
Regan Floating Rate MBS ETF (ticker: MBSF)
PGIM US Large-Cap Buffer 12 ETF – March (ticker: MRCP)
Miller Value Partners Leverage ETF (ticker: MVPL)
Xtrackers RREEF Global Natural Resources ETF (ticker: NRES)
PGIM US Large-Cap Buffer 20 ETF – March (ticker: PBMR)
Swan Enhanced Dividend Income ETF (ticker: SCLZ)
AllianzIM US Large Cap 6 Month Buffer10- March/September ETF (ticker: SIXP)
YieldMax Ultra Option Income Strategy ETF (ticker: ULTY)
SGI Enhnaced Core ETF (ticker: USDX)
ETF Closures
Rareview Inflation/Deflation ETF (ticker: FLTN)
Optimize AI Smart Sentiment Event-Driven ETF (ticker: OAIE)
Arrow Reverse Cap 500 ETF (ticker: YPS)
Fund/Ticker Changes
Fidelity Growth Opportunities ETF (ticker: FGRO)
became Fidelity Fundamental Large Cap Growth ETF (ticker: FFLG)
Fidelity New Millennium ETF (ticker: FMIL)
became Fidelity Fundamental Large Cap Core ETF (ticker: FFLC)
Fidelity Small-Mid Cap Opportunities ETF (ticker: FSMO)
became Fidelity Fundamental Small-Mid Cap ETF (ticker: FFSM)
TETF.Index Performance vs. S&P Financial Select Sector Index
(as of March 1, 2024)
TETF.Index Performance vs. Other Leading Financial Indices
(March 31, 2017 through March 1, 2024)
Why Follow the ETF Industry KPIs
The team at Tidal Investments, originally operating as Toroso Investments, began tracking the ETF Industry Key Performance Indicators (KPIs) in the early 2000s and have been consistently reporting on, and analyzing these metrics ever since. This diligent tracking was the catalyst for the creation of the TETF.Index, an index that tracks the ETF industry. Now, as part of the Tidal Financial Group, which is affiliated with Tidal Investments, LLC, we are positioned to provide even more in-depth analysis and insights. Each week, we will share the statistics we believe to be the most useful for identifying industry trends, in addition to the performance of the TETF.Index.
DISCLAIMER
Past performance is no guarantee of future returns. This article is for informational and educational purposes only; is not intended to constitute legal, tax, accounting, or investment advice; and does not constitute an offer to sell or a solicitation of an offer to buy any security or service. Furthermore, the Indexes shown above are not investable. While Tidal Investments, LLC (formerly known as Toroso Investments, LLC) has gathered the information presented from sources that it believes to be reliable, Tidal Investments, LLC cannot guarantee the accuracy or completeness of the information presented and the information presented should not be relied upon as such. Any opinions expressed are Tidal Investments, LLC’s opinions and do not reflect the opinions of any affiliates or related persons. All opinions are current only as of the date of initial publication and are subject to change without notice. All investment strategies and investments involve risk of loss, including the possible loss of all amounts invested.