Broad Market: Real Estate Bottleneck
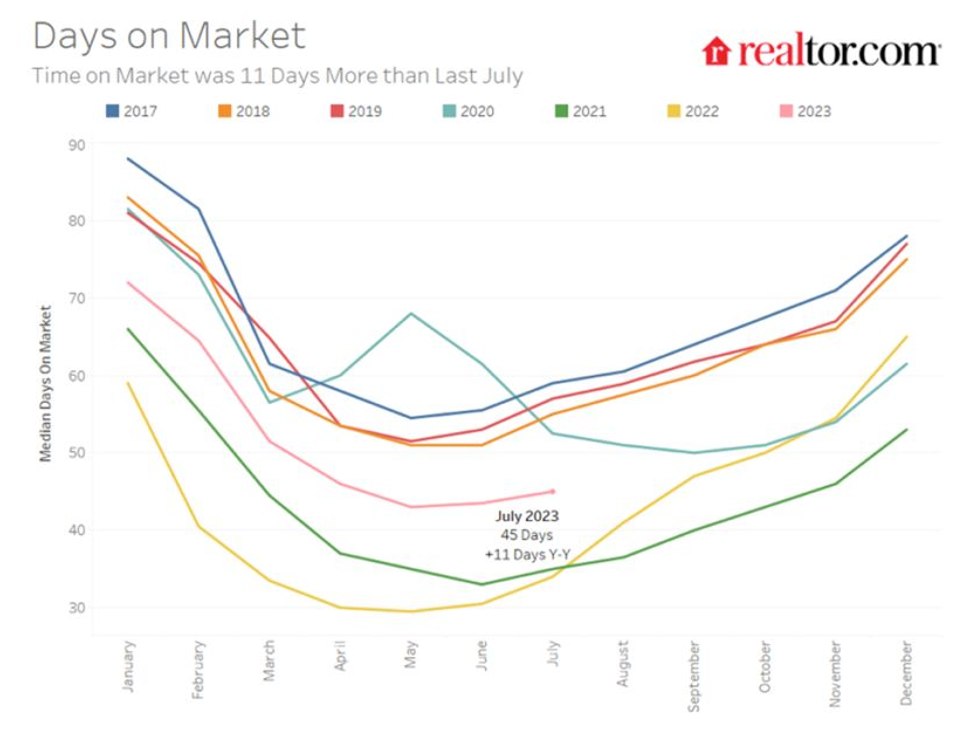
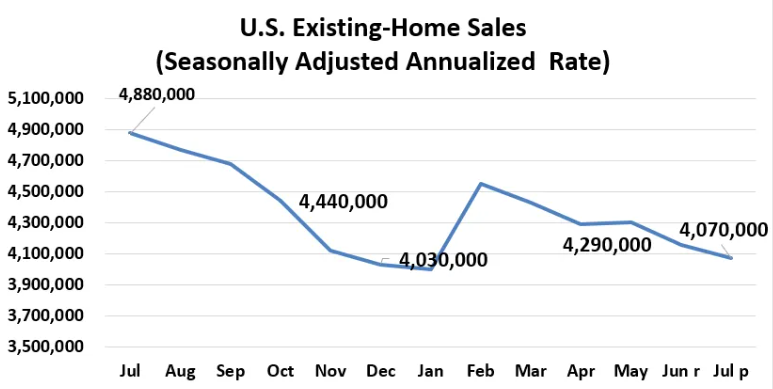
According to the National Association of Realtors (NAR), existing-home sales were down 2.2% month over month, and down 16.6% year over year. This comes with a 3.7% increase in inventory month over month and a 14.6% decrease year over year (See NAR Link) . Of course, where we go from here on price will probably depend on interest rates, unemployment, and consumer confidence. Will the balancing act between buyers and sellers remain in equilibrium? The number of days on the market, according to realtor.com, has increased to 45 days, which is up 11 days year over year (See Realtor Link). All this data, of course, suggests that the national median existing-home price, at $406,700 in July, will not continue to rise, even if it was a meager 1.9%.
Under these circumstances, in hindsight, it is no surprise that capital has been rushing out of the Vanguard Real Estate ETF (VNQ), which had a price peak of $116.01 on December 31, 2021, and a fund value peak of about $49.5 billion on April 20, 2022, with outstanding issuance at 440 million. Today, VNQ shares outstanding are down 12% to 392 million, but this could be just the beginning. Vanguard’s index fund (VGSLX) and the overlapping VNQ ETF both have AUM of about $32 billion, which is about $60-$64 billion in aggregate AUM. Who will be the incremental buyer to hold the flood gates? At best, this looks like a broad index strategy which may be treading water. This is not to say that real estate as an asset class is dead, but rather that private strategies (like owning your own home) or targeted strategies may do better than the broad strategies which have drawn capital for years because of very cheap money. Fortunately, there is the ETF Think Tank to screen for a sniper-like solution.

Hidden Gems: Targeting Performance
There are 57 ETFs focused on real estate across $66.6 billion AUM, but as is often the case, the AUM is concentrated in the largest ETFs between 63% and 67% in the top 3 holdings. In fact, this concentration trend is matched by Technology (63%), Energy (65%), and Healthcare (67%). Additional concentration of the top 3 funds for Consumer Staples (83%), Consumer Cyclical (84%), and Financial (72%) range between 84 and 72%. However, if you are not a trader going for the largest broad fund, VNQ may not be the right answer. We would also highlight that Schwab US REIT (SCHH) at 8 Bps and Fidelity MSCI Real Estate Index (FREL) at 7 Bps have lower costs than Vanguard’s VNQ at 12 Bps, and both have an overlap with VNQ of 85% and 79%, respectively. Clearly, those in VNQ could benefit from a year-end tax swap if an investor wants to stay broad.
There is no secret about the differences and arguable benefits of adding a targeted housing approach to a portfolio through the I-shares US Home Construction ETF (ITB) or the SPDR S&P Homebuilders ETF (XHB). However, we would highlight that the overlap between the two ETFs is just about 50%, and as such, investors should expect some difference between returns. Using a sniper-like approach has its benefits, but by using the ETF Think Tank Comparison tool we also highlight the benefits of measuring industry concentration across ETFs using the Herfindahl-Hirschman Index (HHI).


Real Estate, as measured through the Vanguard VNQ lens, has underperformed since the shares outstanding at 440 million on April 20th, 2022. Call it a bubble? Tick Tock!!

Hidden Gems or Overpriced Beta?
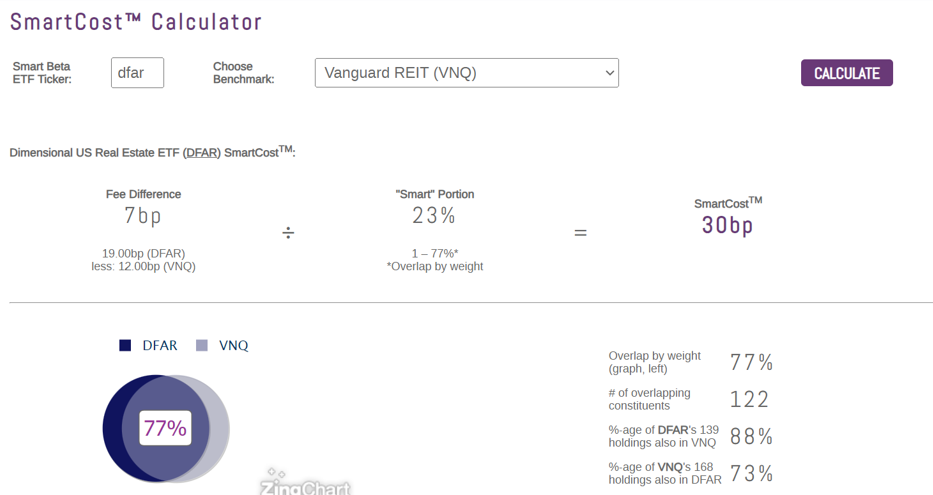
Dimensional Funds is new to the ETF market and built on a cult following. However, while Dimensional is known for its disciplined “alpha generating” strategies, the ETF wrapper is a great truth serum, as it can expose the closet indexers. Using the ETF Think Tank “Smart Cost Calculator,” it becomes clear that the Dimensional Real Estate Fund (DFAR) is an ETF to be avoided. Two reasons: (1) 77% overlap (2) the overlap carries a 30 Bps Smart Cost ratio that puts its investors in front of a potential waterfall of outflows from VNQ, and defines its “active management” as blind to trying to add true value. Hey, don’t call yourself an active fund if you are really a closet indexer!

Real Life Tank Battle Ground Stories:
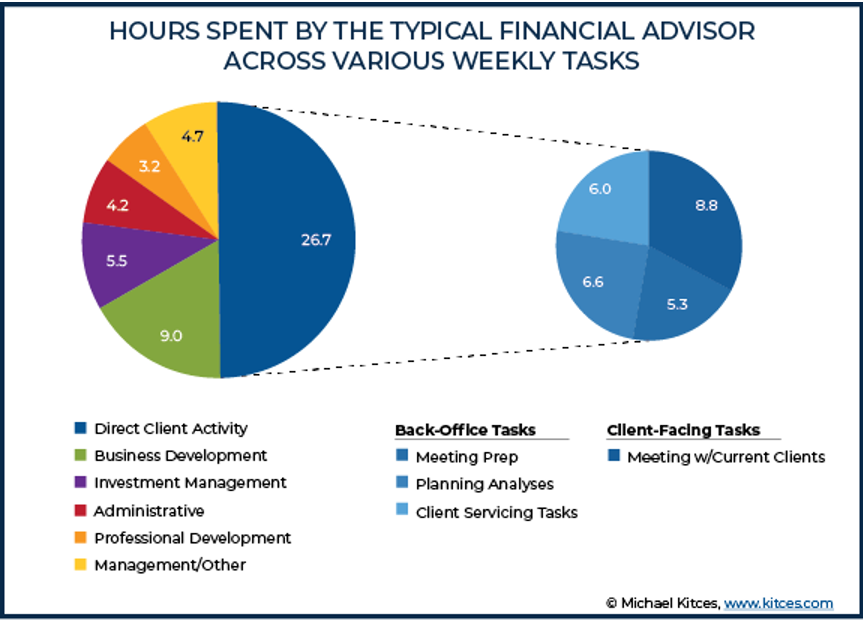
In 2019, Michael Kitces Research conducted a survey on how Financial Advisors spend their time, and pointed out that most financial advisors spend 5.5 hours a week of their time on “Investment Management.” In bull markets that truth may be a reality for FA productivity, but in markets where fixed income isn’t providing a necessary risk buffer, equity valuations at the top are stretched, and macro-economics are leading to potential long-term lifestyle changes, we are proud that our members in the ETF Think Tank spend many more hours than average focused on investment research. Financial advisors who are “long for the Tank” enjoy due diligence and see the benefits and trust of their clients. To that point, those same advisors benefit from our added support and the leverage from our mindshare, experience, and research offering. Do check out the Kitces report.
Inquiry/Perspective: In a LinkedIn survey where 4,040 people were asked (as viewers) whether they preferred paper or digital business cards, 56% voted in favor of paper, out of a total of 81 votes. See Link.

Best Answer:
- Having both is a sure answer to the business card question, but this was purposefully not an option in this poll.
- Moreover, the best answer, of course, was when someone wisely said – “getting someone else’s card is the better of the two answers!”
- In addition, someone else explained that they use LinkedIn as a card and a small note pad that they carry around.
- My favorite answer came from my daughter, but what else would you expect. She said – her generation just doesn’t use paper business cards. If handed a paper card her generation takes a picture of it and hands it back. She is wise and pragmatic beyond her years.
Summary
We rarely go negative in the ETF Think Tank, but investors in the Vanguard Real Estate Complex (ETF or mutual fund) should take a hard look at their investment. Why? Real Estate is a tricky asset class and needs a sniper-like approach to yield good dividends and/or a total return approach. Moreover, while this approach doesn’t have to be active, it should be truly “smart” and not just a solution that is buying into a potential bubble that has burst. The Dimensional Real Estate Fund, as an active fund, has the potential to provide real active share and alpha over VNQ, but to do so it must move away from being a closet indexer.
Disclosure
All investments involve risk, including possible loss of principal.
The material provided here is for informational purposes only and should not be considered an individualized recommendation or personalized investment advice. The investment strategies mentioned here may not be suitable for everyone. Each investor needs to review an investment strategy for his or her own particular situation before making any investment decision.
All expressions of opinion are subject to change without notice in reaction to shifting market conditions. Data contained herein from third party providers is obtained from what are considered reliable sources. However, its accuracy, completeness or reliability cannot be guaranteed.
Examples provided are for illustrative purposes only and not intended to be reflective of results you can expect to achieve.
The value of investments and the income from them can go down as well as up and investors may not get back the amounts originally invested, and can be affected by changes in interest rates, in exchange rates, general market conditions, political, social and economic developments and other variable factors. Investment involves risks including but not limited to, possible delays in payments and loss of income or capital. Neither Toroso nor any of its affiliates guarantees any rate of return or the return of capital invested. This commentary material is available for informational purposes only and nothing herein constitutes an offer to sell or a solicitation of an offer to buy any security and nothing herein should be construed as such. All investment strategies and investments involve risk of loss, including the possible loss of all amounts invested, and nothing herein should be construed as a guarantee of any specific outcome or profit. While we have gathered the information presented herein from sources that we believe to be reliable, we cannot guarantee the accuracy or completeness of the information presented and the information presented should not be relied upon as such. Any opinions expressed herein are our opinions and are current only as of the date of distribution, and are subject to change without notice. We disclaim any obligation to provide revised opinions in the event of changed circumstances.
The information in this material is confidential and proprietary and may not be used other than by the intended user. Neither Toroso or its affiliates or any of their officers or employees of Toroso accepts any liability whatsoever for any loss arising from any use of this material or its contents. This material may not be reproduced, distributed or published without prior written permission from Toroso. Distribution of this material may be restricted in certain jurisdictions. Any persons coming into possession of this material should seek advice for details of and observe such restrictions (if any).