Week of January 23, 2023 KPI Summary
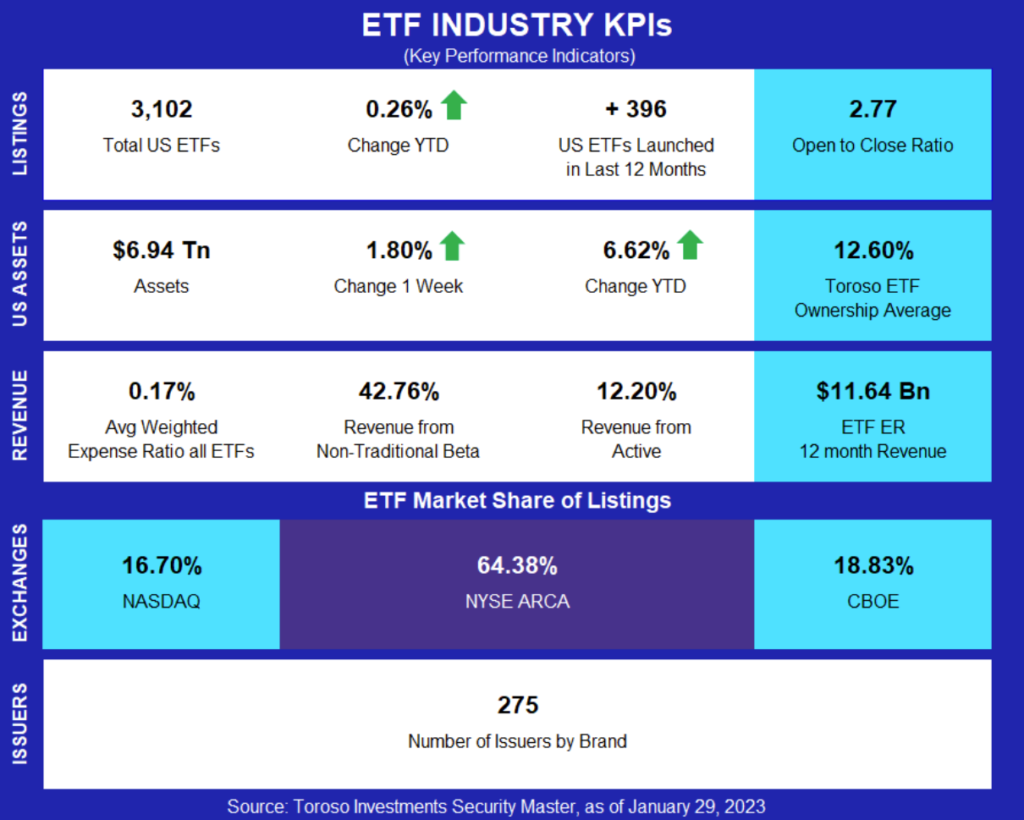
This week we are 4 for 4, welcoming 4 ETF launches and seeing 4 ETF closures, bringing the open-to-close ratio to 2.77.
- The pace of ETF launches remains robust, with nearly 400 new funds entering the market in the past 12 months.
- Asset growth, too, is showing resilience despite challenging markets. So far in 2023, total U.S.-listed ETF assets have risen some 6.6% (asset flows + performance) nearing the $7 trillion mark.
Two noteworthy events this week among the launches and closures:
- Among the ETF launches, one brand new issuer entered the ETF market: Panagram Structured Asset Management, a firm specializing in credit asset management.
- Their ETF offers access to BBB-B-rated collateralized loan obligations (CLOs), ticker “CLOZ”. This is the second CLO ETF to launch just this year, broadening access to a segment of the market that has been known to be the turf of institutions and professional investors.
- Most ETF closures take place in the first 1 to 3 years of a fund – those are the hardest asset gathering years until a fund has enough live track record and asset base to find its way into various platforms and the advisory channel.
- This week, however, we bid farewell to an ETF that was about to celebrate its sweet 16: FNI from First Trust.
- FNI was an emerging market equity ETF focused on Asia-Pacific. This is an ETF segment that is really small, and currently includes only a couple of ETF from issuers including Matthews Asia, DawnGlobal and Guinness Atkinson.
ETF Launches
FT Cboe Vest U.S. Equity Moderate Buffer ETF (ticker: GJAN)
Panagram BBB-B Clo ETF (ticker: CLOZ)
Fidelity Tactical Bond ETF (ticker: FTBD)
Timothy Plan Market Neutral ETF (ticker: TPMN)
ETF Closures
First Trust Chindia ETF (ticker: FNI)
AXS FOMO ETF (ticker: FOMO)
Amberwave Invest USA JSG ETF (ticker: IUSA)
QRAFT AI-Enhanced US High Dividend ETF (ticker: HDIV)
Fund/Ticker Changes
None
TETF.Index Performance vs. S&P Financial Select Sector Index
(as of January 27, 2023)

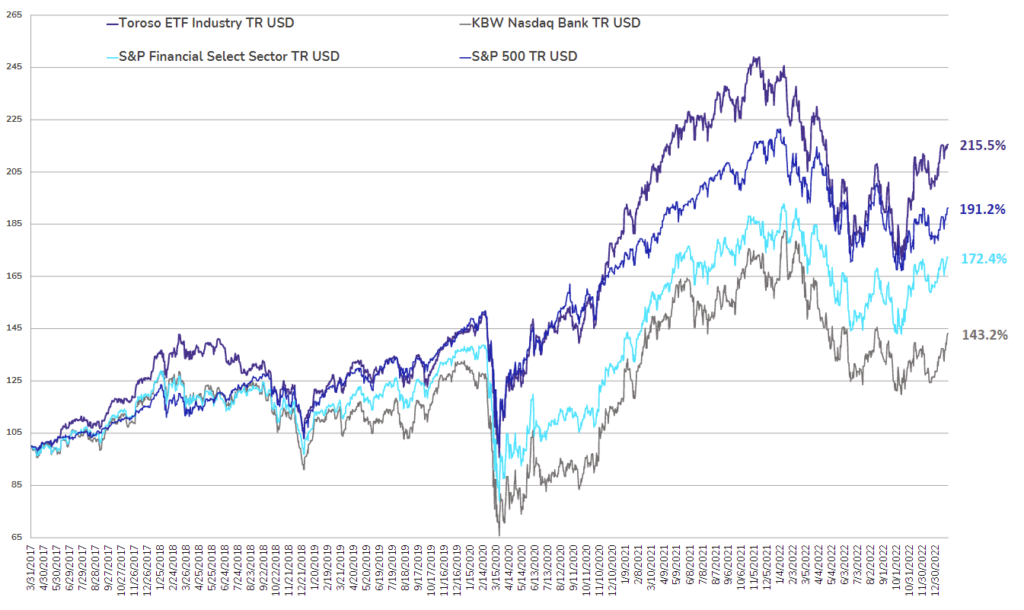
TETF.Index Performance vs. Other Leading Financial Indices
(March 31, 2017 through January 27, 2023)
Source: Morningstar Direct
Why Follow the ETF Industry KPIs
The team at Toroso Investments began tracking the ETF Industry Key Performance Indicators (KPI’s) in the early 2000’s and have been consistently reporting on, and analyzing these metrics ever since. The table above was the impetus for the creation of the TETF.Index, the index that tracks the ETF industry. Each week, we will share the statistics we believe to be the most useful for identifying industry trends, in addition to the performance of the TEFT.Index.
DISCLAIMER
Past performance is no guarantee of future returns. This article is for informational and educational purposes only; is not intended to constitute legal, tax, accounting or investment advice; and does not constitute an offer to sell or a solicitation of an offer to buy any security or service. Furthermore, the Indexes shown above are not investable. While Toroso has gathered the information presented from sources that it believes to be reliable, Toroso cannot guarantee the accuracy or completeness of the information presented and the information presented should not be relied upon as such. Any opinions expressed are Toroso’s opinions and do not reflect the opinions of any affiliates or related persons. All opinions are current only as of the date of initial publication and are subject to change without notice. All investment strategies and investments involve risk of loss, including the possible loss of all amounts invested.


