Week of January 16, 2023 KPI Summary
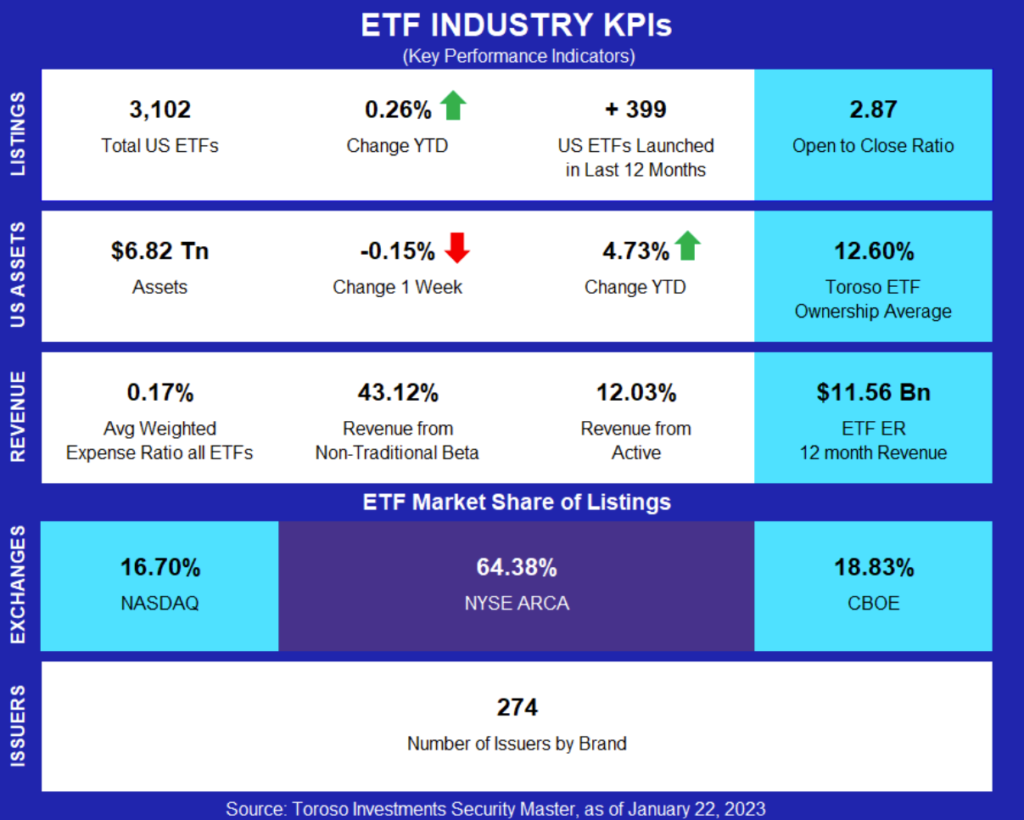
- This week, the industry experienced 6 ETF launches and 2 closures, shifting the 1-year Open-to-Close ratio to 2.87 and total US ETFs to 3,102.
- Happy Monday to our ETF Think Tank members, ETF Nerds, and our wonderful ETF Industry, which is celebrating its 30th Birthday today! On January 22, 1993, SPY was seeded with $6.5 million, and a LOT has happened since then. Today, we want to shout out some other recent milestones of the ETF Industry that may have otherwise been overlooked or forgotten.
- The total US ETF count is over 3,100 for the first time. The 3,000 ETF milestone was reached on August 29, 2022, and 2,900 ETFs attained on April 4, 2022. Incredibly, August 29 is 147 days ago, and April 4 is exactly 147 days before that – pretty wild! With that trend, the 3,200 milestone should be reached on Monday June 19, 2023. Mark your calendars.
- The 12-month Open-to-close ratio is currently 2.87. In 2020, the ratio hovered around 1:1, then rose high into the fives by early 2022. The pendulum has swung back to the middle, and it has not been around this ratio (2.87) since October 3, 2021, almost 16 months ago.
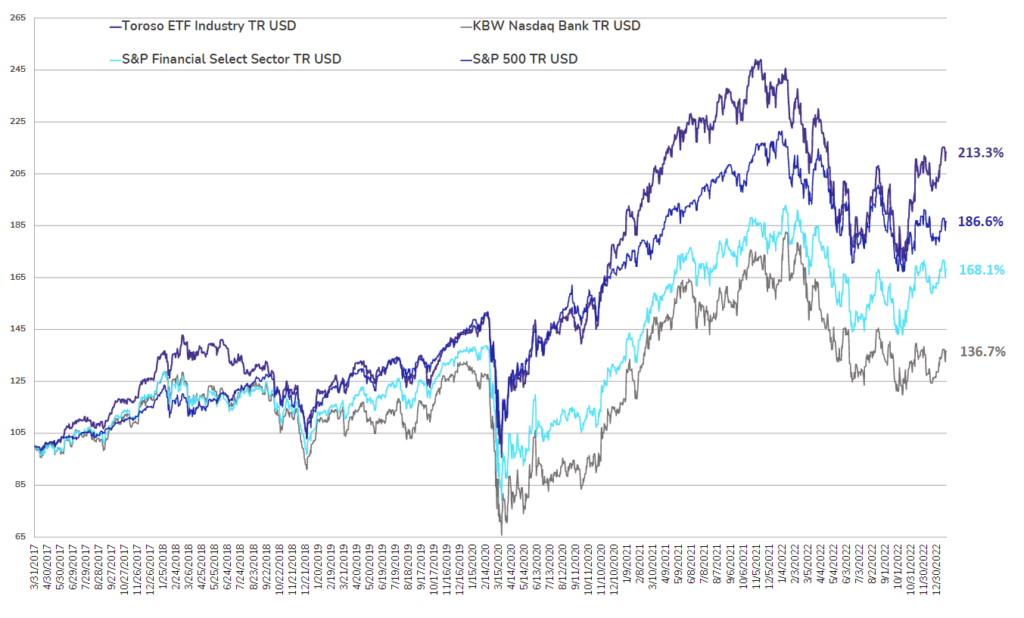
- Since the industry is 30 years old today, let’s see how our indexes compare since their inceptions. Since inception, the Toroso ETF Industry Index is up 13.88% while the S&P Financial Select Sector Index trails at 9.32%.
ETF Launches
PIMCO Preferred and Capital Securities Active ETF (ticker: PRFD)
Putnam ESG Core Bond ETF (ticker: PCRB)
Putnam ESG High Yield ETF (ticker: PHYD)
Putnam ESG Ultra Short ETF (ticker: PULT)
Putnam PanAgora ESG Emerging Markets Equity ETF (ticker: PPEM)
Putnam PanAgora ESG International Equity ETF (ticker: PPIE)
ETF Closures
Capital Link Global Green Energy Transport & Technology Leaders ETF (ticker: EKAR)
PGIM Quant Solutions Strategic Alpha International Equity ETF (ticker: PQIN)
Fund/Ticker Changes
None
TETF.Index Performance vs. S&P Financial Select Sector Index
(as of January 20, 2023)

TETF.Index Performance vs. Other Leading Financial Indices
(March 31, 2017 through January 20, 2023)
Source: Morningstar Direct
Why Follow the ETF Industry KPIs
The team at Toroso Investments began tracking the ETF Industry Key Performance Indicators (KPI’s) in the early 2000’s and have been consistently reporting on, and analyzing these metrics ever since. The table above was the impetus for the creation of the TETF.Index, the index that tracks the ETF industry. Each week, we will share the statistics we believe to be the most useful for identifying industry trends, in addition to the performance of the TEFT.Index.
DISCLAIMER
Past performance is no guarantee of future returns. This article is for informational and educational purposes only; is not intended to constitute legal, tax, accounting or investment advice; and does not constitute an offer to sell or a solicitation of an offer to buy any security or service. Furthermore, the Indexes shown above are not investable. While Toroso has gathered the information presented from sources that it believes to be reliable, Toroso cannot guarantee the accuracy or completeness of the information presented and the information presented should not be relied upon as such. Any opinions expressed are Toroso’s opinions and do not reflect the opinions of any affiliates or related persons. All opinions are current only as of the date of initial publication and are subject to change without notice. All investment strategies and investments involve risk of loss, including the possible loss of all amounts invested.


