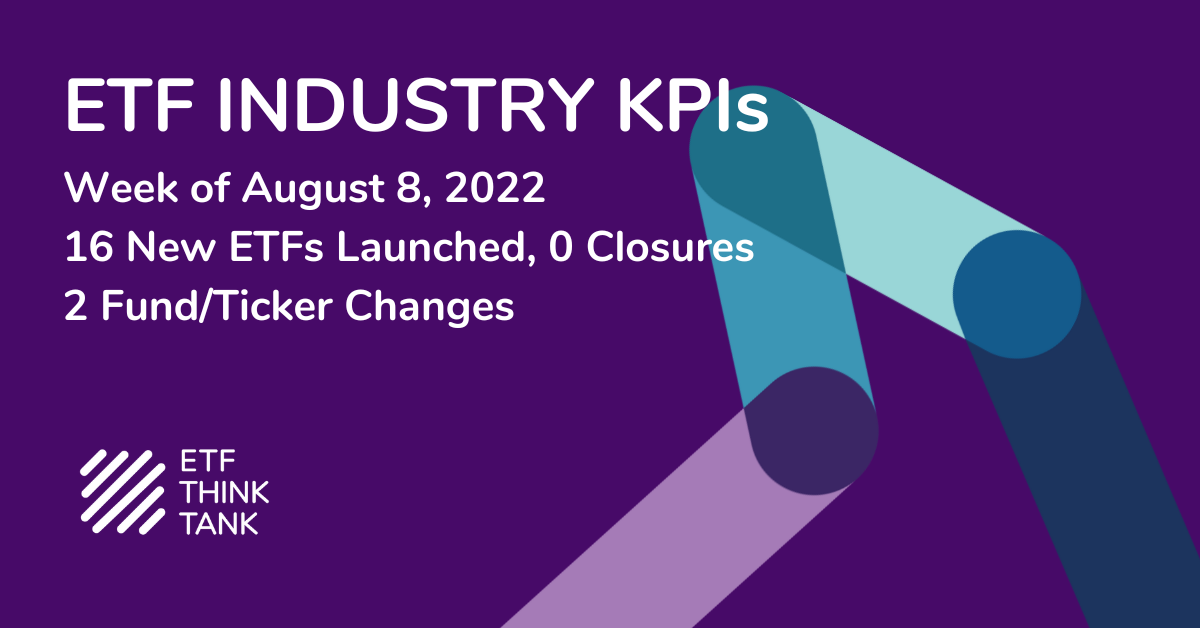
Week of August 8, 2022 KPI Summary
- This week, the industry experienced 16 ETF launches and 0 closures, shifting the 1-year Open-to-Close ratio to 3.76 and total US ETFs to 2,992.
- With another week of good asset performance for the ETF industry, it reaches $6.85 Trillion – which we haven’t seen since April 2022.
- These hot summer days have us thinking about solar power and all the renewable energy sources our planet provides. There are a lot of assets invested in the renewable energy segment, and lots of ETF strategies with which to access this theme. Let’s take a look at Clean Energy ETFs and how they’ve performed this year.
-
- There are 30 funds in this category (according to Morningstar) totaling $15.1 Billion.
- The largest fund is iShares Global Clean Energy ETF (ICLN) at approximately $5.96 Billion. In fact, the top 5 ETFs constitute 80% of the $15.1 Bn AUM of the category.
- In the last 3 months, all 30 funds have positive performance in assets with an average of 27.4% increase and high of 90.4% by KLNE, Direxion Daily Global Clean Energy Bull 2X Shares. The best performing non-leveraged fund is ProShares S&P Kensho Cleantech ETF, CTEX, with 63.2% change.
- However, in a 1-year outlook, the category is down -4.8% with the best performer at 14.8%, First Trust EIP Carbon Impact ETF (ECLN), with the next best far behind at 5.8%.
- The average expense ratio of the category is 0.47.
- Both indexes experienced significant change last week. Toroso ETF Industry Index was up 4.51% while the S&P Financial Select Sector Index led at 5.49%.

ETF Launches
Direxion Daily AAPL Bear 1X Shares ETF (ticker: AAPD)
Direxion Daily AAPL Bull 1.5X Shares ETF (ticker: AAPU)
Direxion Daily TSLA Bear 1X Shares ETF (ticker: TSLS)
Direxion Daily TSLA Bull 1.5X Shares ETF (ticker: TSLL)
GraniteShares 1.25x Long Tsla Daily ETF (ticker: TSL)
GraniteShares 1.5x Long COIN Daily ETF (ticker: CONL)
GraniteShares 1.75x Long AAPL Daily ETF (ticker: AAPB)
GraniteShares 1x Short TSLA Daily ETF (ticker: TSLI)
JPMorgan Active Growth ETF (ticker: JGRO)
SoFi Web 3 ETF (ticker: TWEB)
Strive U.S. Energy ETF (ticker: DRLL)
US Treasury 10 Year Note ETF (ticker: UTEN)
US Treasury 2 Year Note ETF (ticker: UTWO)
US Treasury 3 Month Bill ETF (ticker: TBIL)
Direxion Daily Electric & Autonomous Vehicles Bull 2X ETF (ticker: EVAV)
Innovator Uncapped Accelerated US Equity ETF (ticker: XUSP)
ETF Closures
None
Fund/Ticker Changes
The SoFi Gig Economy ETF (ticker: GIGE)
became SoFi Be Your Own Boss ETF (ticker: BYOB)
iClima Distributed Smart Energy ETF (ticker: SHFT)
became SoFi Smart Energy ETF (ticker: ENRG)

TETF.Index Performance vs. Other Leading Financial Indices
(March 31, 2017 through August 12, 2022)

Source: Morningstar Direct
Why Follow the ETF Industry KPIs
The team at Toroso Investments began tracking the ETF Industry Key Performance Indicators (KPI’s) in the early 2000’s and have been consistently reporting on, and analyzing these metrics ever since. The table above was the impetus for the creation of the TETF.Index, the index that tracks the ETF industry. Each week, we will share the statistics we believe to be the most useful for identifying industry trends, in addition to the performance of the TEFT.Index.
DISCLAIMER
Past performance is no guarantee of future returns. This article is for informational and educational purposes only; is not intended to constitute legal, tax, accounting or investment advice; and does not constitute an offer to sell or a solicitation of an offer to buy any security or service. Furthermore, the Indexes shown above are not investable. While Toroso has gathered the information presented from sources that it believes to be reliable, Toroso cannot guarantee the accuracy or completeness of the information presented and the information presented should not be relied upon as such. Any opinions expressed are Toroso’s opinions and do not reflect the opinions of any affiliates or related persons. All opinions are current only as of the date of initial publication and are subject to change without notice. All investment strategies and investments involve risk of loss, including the possible loss of all amounts invested.


