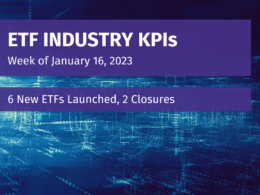
Week of March 21, 2022 KPI Summary
- This week, the industry experienced 9 ETF launches and 3 closures, shifting the 1-year Open-to-Close ratio to 4.84 and total US ETFs to 2,893.
- One section of our KPIs that we haven’t touched on recently is Geography. Our ETF Geography is broken up into 4 categories: International, US, Emerging, and Global.
- Since March 28, 2021, US assets have grown the most at 20.3% while Emerging has actually dropped -2.67% in assets. As a result, US ETF assets now constitute approximately 77% of total ETF assets. The next largest is International (10.5%), followed by Emerging (4.7%) and Global (3.4%).
- Here are some quick 1-year stats on our 3 exchanges as well.
- NYSE grew the most in assets, approximately 19.2%, with Nasdaq (18.3%) and CBOE (15.9%) close behind.
- NYSE also grew the most in listings (18.9% or 300 listings). Though CBOE only grew by 84 ETFs, it was close behind in percentage growth with 17.7%. Nasdaq was in third place in both with 33 listings accounting for 8.0% increase.
- Both indexes experienced growth last week. The Toroso ETF Industry Index was up 0.04% while the S&P Financial Select Sector Index led at 1.67%.

ETF Launches
WisdomTree Efficient Gold Plus Equity Strategy ETF (ticker: GDE)
BNY Mellon Responsible Horizons Corporate Bond ETF (ticker: RHCB)
Fairlead Tactical Sector ETF (ticker: TACK)
First Trust Nasdaq Lux Digital Health Solutions ETF (ticker: EKG)
Dimensional International Core Equity 2 ETF (ticker: DFIC)
Dimensional International High Profitability ETF (ticker: DIHP)
Dimensional International Small Cap Value ETF (ticker: DISV)
Dimensional International Small Cap ETF (ticker: DFIS)
ROC ETF (ticker: ROC)
ETF Closures
Direxion Daily Russia Bull 2X ETF (ticker: RUSL)
Xtrackers Japan JPX-Nikkei 400 Equity ETF (ticker: JPN)
Xtrackers Eurozone Equity ETF (ticker: EURZ)
TETF.Index Performance vs. S&P Financial Select Sector Index
(as of March 25, 2022)

TETF.Index Performance vs. Other Leading Financial Indices
(March 31, 2017 through March 25, 2022)

Source: Morningstar Direct
Why Follow the ETF Industry KPIs
The team at Toroso Investments began tracking the ETF Industry Key Performance Indicators (KPI’s) in the early 2000’s and have been consistently reporting on, and analyzing these metrics ever since. The table above was the impetus for the creation of the TETF.Index, the index that tracks the ETF industry. Each week, we will share the statistics we believe to be the most useful for identifying industry trends, in addition to the performance of the TEFT.Index.
DISCLAIMER
Past performance is no guarantee of future returns. This article is for informational and educational purposes only; is not intended to constitute legal, tax, accounting or investment advice; and does not constitute an offer to sell or a solicitation of an offer to buy any security or service. Furthermore, the Indexes shown above are not investable. While Toroso has gathered the information presented from sources that it believes to be reliable, Toroso cannot guarantee the accuracy or completeness of the information presented and the information presented should not be relied upon as such. Any opinions expressed are Toroso’s opinions and do not reflect the opinions of any affiliates or related persons. All opinions are current only as of the date of initial publication and are subject to change without notice. All investment strategies and investments involve risk of loss, including the possible loss of all amounts invested.