Week of July 5, 2021 KPI Summary
- This week, the industry experienced 6 new ETF launches and 1 closure, shifting the 2021 YTD Open-to-Close ratio to 2.13 and total US ETFs to 2,575.
- As the 2nd Quarter of 2021 has wrapped up, let’s take a look at some influential KPIs.
- Total ETFs were up 78 (+3.05%) and total assets increased $456.8 Billion (+7.04%).
- The two best performing sectors were Commodities Derivative (28.10%) and Options (21.64%) and worst performing sectors were Volatility (-16.71%) and Currency (1.98%).
- The two largest sectors, Equity and Fixed Income, performed well, increasing 7.86% and 6.28% respectively.
- All four geographical sectors improved in a very balanced way. International increased 7.97% and Emerging, as the worst of the four, increased 6.39%.
- ETF ER 12-Month Revenue increased from $10.27 Bn to $12.01 Bn.
- Number of issuers by Brand grew from 185 to 196.
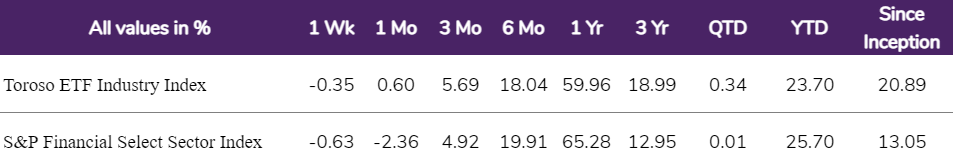
- Both indexes experienced change in 2021 Q2, Toroso ETF Industry Index was up 10.67% while the S&P Financial Select Sector Index trailed at 9.07%.

ETF Launches
Sparkline Intangible Value ETF (ticker: ITAN)
ETFMG 2X Daily Alternative Harvest ETF (ticker: MJXL)
Zega Buy and Hedge ETF (ticker: ZHDG)
iShares® iBonds® 2027 Term High Yield & Income ETF (ticker: IBHG)
JPMorgan ActiveBuilders International Equity ETF (ticker: JIDA)
JPMorgan ActiveBuilders US Large Cap Equity ETF (ticker: JUSA)
ETF Closures
Amplify CrowdBureau® Peer-to-Peer Lending &Crowdfunding ETF (ticker: LEND)
TETF.Index Performance vs. S&P Financial Select Sector Index
(as of July 9, 2021)
TETF.Index Performance vs. Other Leading Financial Indices
(March 31, 2017 through July 9, 2021)

Source: Morningstar Direct
Why Follow the ETF Industry KPIs
The team at Toroso Investments began tracking the ETF Industry Key Performance Indicators (KPI’s) in the early 2000’s and have been consistently reporting on, and analyzing these metrics ever since. The table above was the impetus for the creation of the TETF.Index, the index that tracks the ETF industry. Each week, we will share the statistics we believe to be the most useful for identifying industry trends, in addition to the performance of the TEFT.Index.
DISCLAIMER
Past performance is no guarantee of future returns. This article is for informational and educational purposes only; is not intended to constitute legal, tax, accounting or investment advice; and does not constitute an offer to sell or a solicitation of an offer to buy any security or service. Furthermore, the Indexes shown above are not investable. While Toroso has gathered the information presented from sources that it believes to be reliable, Toroso cannot guarantee the accuracy or completeness of the information presented and the information presented should not be relied upon as such. Any opinions expressed are Toroso’s opinions and do not reflect the opinions of any affiliates or related persons. All opinions are current only as of the date of initial publication and are subject to change without notice. All investment strategies and investments involve risk of loss, including the possible loss of all amounts invested.