


February Month End KPI
Innovation Fueling Growth
Innovation is clearly accelerating in the ETF market in 2021. We see this in the AUM growth. AUM concluded February at $5.76 trillion up 5.55% YTD; but year over year AUM also increased a remarkable 37.5% or $1.57 trillion from $4.18 trillion last February 2020. ETFs as solutions to dynamic market conditions have also shown an increase. Revenue from actively managed ETFs now represent 10% of the $9.99 billion for the projected next 12 month Expense Ratio Revenues (ERR). A year ago this number was 6.6% of the $7.7 billion of the ERR; so while the average fee remains flat at 18 Bps there is evidence that pricing power exists for differentiated solutions that are active.
Active Flows & Performance
Year-to-date ETF net asset flows totaled $154 billion, pushing total U.S.-listed ETF assets above $5.71 trillion. Active ETFs now represent $203.56 billion, or 3.55%, of the total ETF AUM. There are more than 500 actively managed ETFs in the market, or 21%, of the total number of ETFs. The average fee for active is 47 Bps and the weighted fee is 52 Bps. ARK Invest, arguably the most successful active ETF sponsor, charges anywhere from 49 to 79 bps for its funds, and the firm saw nearly $40 billion in inflows in the past 12 months. Again, this is evidence that where alpha is delivered, flows will follow.
New Entrants are Active
Evidence of innovation is also reflected in the number of new issuers by brand embracing the ETF wrapper. Today there are 175 new brands competing for investor dollars – an increase from 144 a year ago. Price will always matter for some investors, but ultimately it is clear that the ETF market is adapting to new market conditions with active and/or alternative types of portfolio managers providing meaningful high active share and potential alpha.
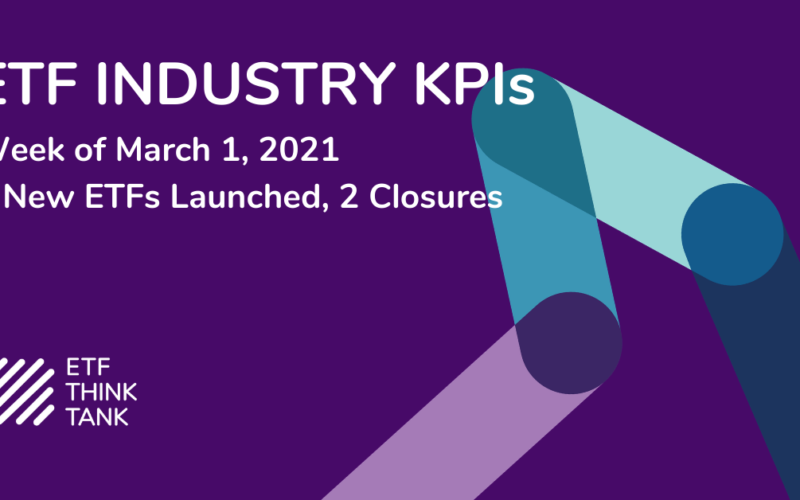
Steady Launches, Closures Slow
The number of ETFs year over year has risen to 2,453 up from 2,327 at the conclusion of February 2020, and year to date is up 1.53%. This growth reflects a new equilibrium between the open/close rate which now stands at about 1. New launches over these past 12 months are 335 versus closures of 227. ETF product contraction is healthy for the ETF industry – an open/close ratio of .84 bottomed with 239 launches/284 closures in November 2020. This indicates a return to a healthy ETF market with the 12 month open to close ratio at 1.13 to 1, since innovation is flourishing while the culling of unsuccessful products has slowed.

Disclosure
The information provided here is for financial professionals only and should not be considered an individualized recommendation or personalized investment advice. The investment strategies mentioned here may not be suitable for everyone. Each investor needs to review an investment strategy for his or her own particular situation before making any investment decision.
All expressions of opinion are subject to change without notice in reaction to shifting market conditions. Data contained herein from third party providers is obtained from what are considered reliable sources. However, its accuracy, completeness or reliability cannot be guaranteed.
Examples provided are for illustrative purposes only and not intended to be reflective of results you can expect to achieve.
All investments involve risk, including possible loss of principal.
The value of investments and the income from them can go down as well as up and investors may not get back the amounts originally invested, and can be affected by changes in interest rates, in exchange rates, general market conditions, political, social and economic developments and other variable factors. Investment involves risks including but not limited to, possible delays in payments and loss of income or capital. Neither Toroso nor any of its affiliates guarantees any rate of return or the return of capital invested. This commentary material is available for informational purposes only and nothing herein constitutes an offer to sell or a solicitation of an offer to buy any security and nothing herein should be construed as such. All investment strategies and investments involve risk of loss, including the possible loss of all amounts invested, and nothing herein should be construed as a guarantee of any specific outcome or profit. While we have gathered the information presented herein from sources that we believe to be reliable, we cannot guarantee the accuracy or completeness of the information presented and the information presented should not be relied upon as such. Any opinions expressed herein are our opinions and are current only as of the date of distribution, and are subject to change without notice. We disclaim any obligation to provide revised opinions in the event of changed circumstances.
The information in this material is confidential and proprietary and may not be used other than by the intended user. Neither Toroso or its affiliates or any of their officers or employees of Toroso accepts any liability whatsoever for any loss arising from any use of this material or its contents. This material may not be reproduced, distributed or published without prior written permission from Toroso. Distribution of this material may be restricted in certain jurisdictions. Any persons coming into possession of this material should seek advice for details of and observe such restrictions (if any).