The Fed’s blessing, as the biggest central bank on the globe, to buy ETFs is a watershed moment no matter how you cut it; and investors reacted by pumping money into the markets as Summit Roy points out – ETF flows were $48.8 billion in April. YTD flows bringing the total to $121.1 billion. All this, of course has led to market sentiment flipping positive again and it is clear that the ETF wrapper is a hero in building investor confidence towards the ability to provide price discovery, maintain orderly markets and reflect investor sentiment. While the downside looked ugly and some today argue the upside appears irrational, confidence in the Fed’s aggressive actions using ETFs has made certain market participants feel flush again and rewarded those complacent so sellers are back on the sidelines. Nevertheless, Assets Under Management as of May 3, 2020 were down to $3.96 Trillion as compared to $4.44 trillion as of December 31, 2019.

The Open To Close Ratio Will Be Seeing Headwinds in Q2 2020
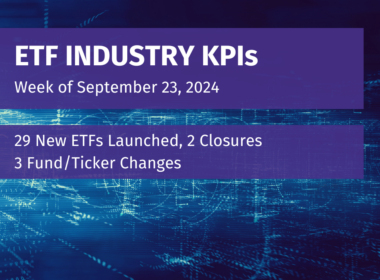
Since our last report on the month of February, a lot has changed in this area. For the first time in history, the industry trailing 12 month Open-Close Ratio dipped below to .97 (211/218). This was telegraphed by the Invesco news back in December. The number of ETFs traded in the US now stands at 2,270 down from 2,298. Launches during April and March were concentrated in a few issuers hands and totaled 8 in March and 27 in April (American Century, Innovator and BNY Mellon).
American Century, arguably, was the most important launch relative to innovation with its active ETFs in terms of AUM. Noteworthy is the fact that BNY Mellon free ETFs were launched with the largest AUM base for the month. Innovation is the life blood of our industry, which I write about in a white paper entitled, “Measuring ETF Innovation.” In this paper, I write about a new industry KPI that measures a ratio between Low Cost Solutions vs Access, Alphas and Active. As our industry is known for acronyms we came up with ACAI or “Annual Client Alignment to Innovation (ACAI).” How these three different series of fund families succeed as measured by ACAI will be an interesting test of the KPI metrics over time.
Revenue from Active now stand at 6.68%
Active ETF strategies gained momentum over the past 2 extraordinary months, and now represent 2.50% of the Total US ETF AUM (previously 2.31%), but what is more curious is the fact that 6.68% of the ETF ER 12 Month Revenue projection is now in active vs. previously it was 6.05%. This increase came as AUM by about 10% and therefore projected revenue declined to $7.2 billion from the last 12 month run rate projection of $8.25 billion. The change came mostly as Active ETFs stayed flat at about $102 billion in AUM while passive declined. As a baseline, at the end of January, it is noteworthy that there were 280 ETFs that are fully transparent actively managed ETFs and this number is now 275. The revenue number is up from $6.83 billion in December 2018 and will bounce around, but reflects an important aspect of innovation in the ETF industry.

Innovation Beyond Just Low Cost Is What Will Lead to ETF AUM Growth
The current framework of the ETF industry has 1,325 Equity ETFs or 58% of the market AUM. However, the future framework of the ETF market will be about market conditions and how ETF sponsors build ETFs that are aligned with current client investor needs. Put simply, the success of firms like Innovator, American Century and BNY Mellon come from meeting the right needs at the right time. In the study, Measuring ETF Innovation, I point out that assets of the top largest 220 ETFs launched from 2009 through 2019 at the end of 2019 represented $688 billion across 74 Low Cost Solution ETFs and $1.3 Trillion raised. This means that beyond cost Active, Access and Alpha made up the smaller balance at $414 billion, but the questions need to be asked about whether cost will remain the lead determinant for ETF market acceptance at this point; specially if market conditions and risks no longer rationally favor market cap weighted ETFs. Measuring ETF innovation is important because If past performance is not indicative of future outcomes we need ETF innovation to provide the opportunity for better outcomes, diversification or differentiated risk-adjusted solutions.
Bottom line, the success of these 146 Top 20 ETFs with AUMs of $414 billion were identified by discerning investors seeking differentiation and choice rather than homogeneous low cost?
TETF.Index Performance


Returns as of May 8, 2020. Index performance is for informational purposes only and does not represent any ETF. Indexes are unmanaged and one cannot invest directly in an index. Past performance is NOT indicative of future results, which can vary. |