US ETF Asset Growth
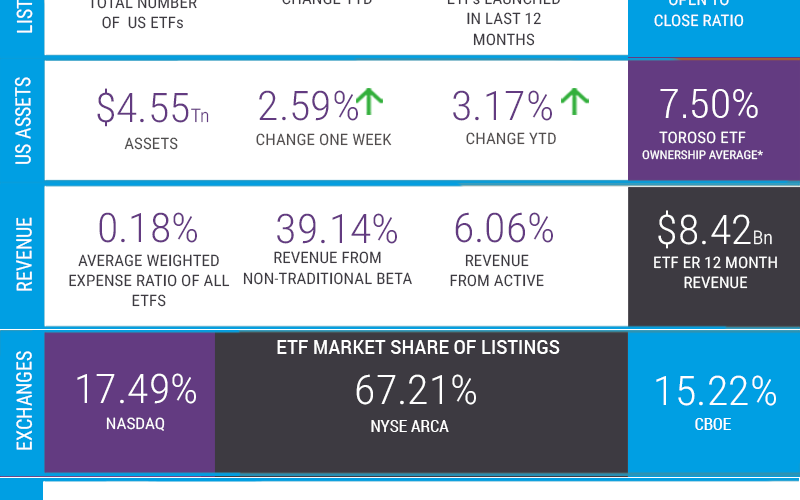
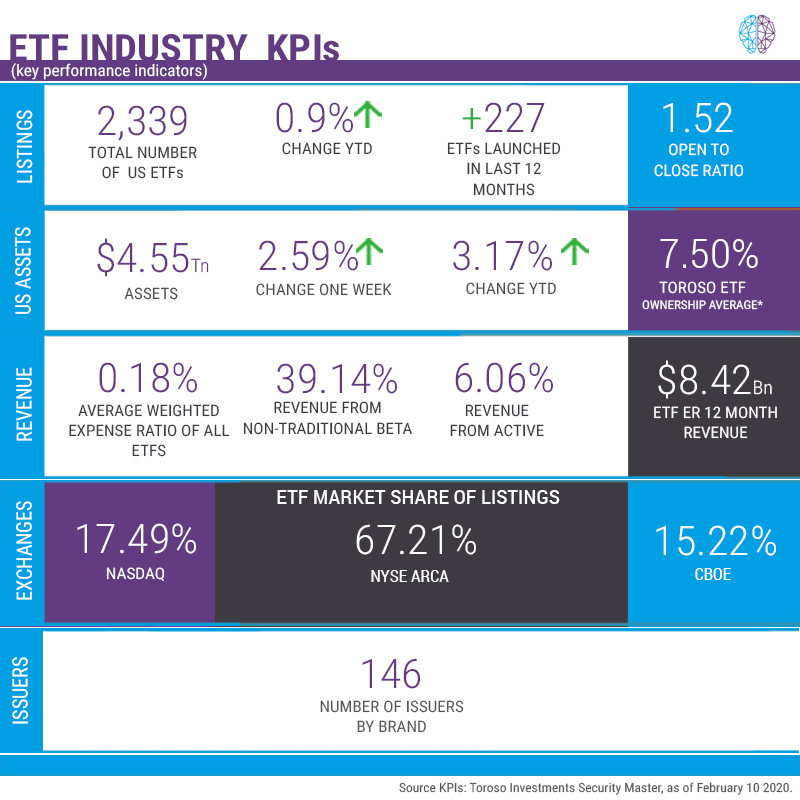
Market sentiment is generally positive, and it is clear that the ETF evolution will gather trillions of dollars much faster than in the last decade. Having said that, Assets Under Management in January closed at $4.44 trillion – flat from year-end December 31, 2019.
The Open to Close Ratio Will Be Seeing Headwinds in Q1 2020
In January, the number of ETFs traded in the US declined slightly to 2,298 with an Open-to-Close ratio of 1.43 (221/155). Again, we know the 42 Invesco closures coming in Q1 will tilt this ratio close to 1. This is just math, not a reflection of the innovation talk in the air. To that point, we welcome 5 new brands, which brings the brand count to 146.
Fixed Income ETF Growth Accelerating
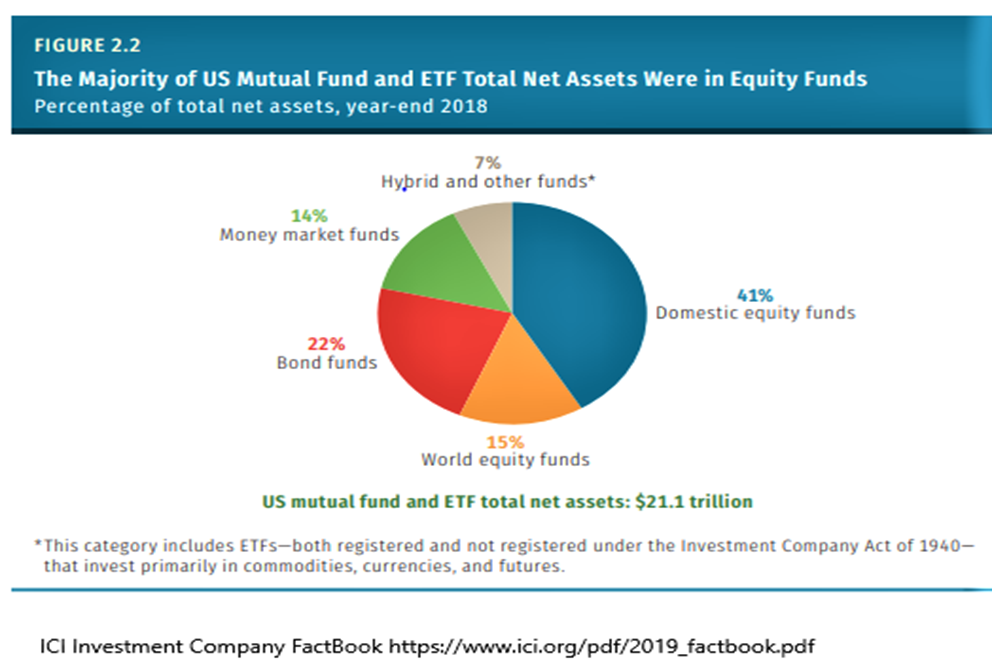
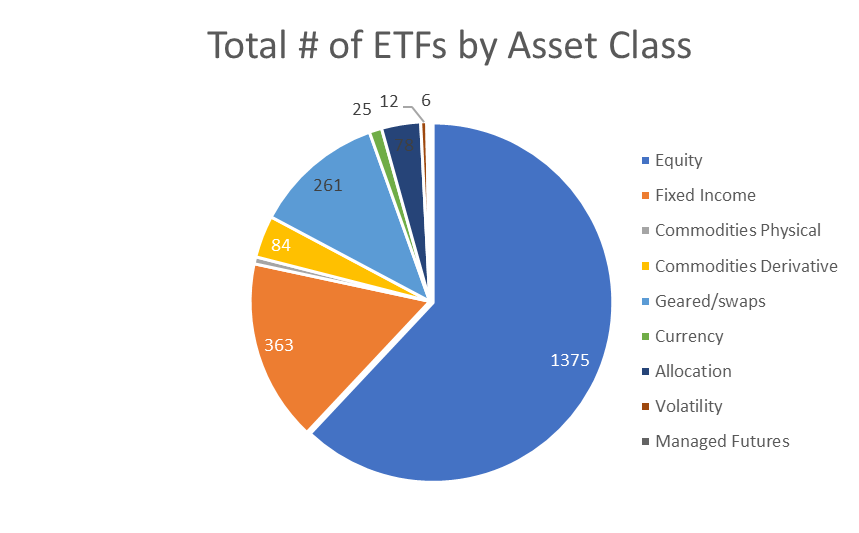
Whether fixed income inflows eclipsed equity flows in 2019 is besides the point. The fact is, ETFs as a wrapper are the modern solution, and asset managers with mutual funds are beginning to embrace the reality that investors already know. This is important to recognize since it is arguably a core reason that trillions are coming into fixed income ETFs over the course of the next decade. The Investment Company Institute pointed this out in their 2019 Factbook: bonds funds, as fixed income, are 22% of the US $21 trillion combined AUM, which is in line with the 18.86% or $838 billion in ETF AUM. However, given the efficiencies of the ETF wrapper, transference will happen organically, especially given the generational trends towards ETFs and planning for retirement. Domestic and Global Equities traded through US ETFs represented 77% of ETF AUM as of the end of January. (Note that the below chart is used to show where the puck is going, but is from 2018. Dollar values are probably larger and percentages are within the range)
Revenue from Active Eclipse 6%
Active is alive and well in the ETF marketplace. While it is only 2.31% of the Total US ETF AUM, it is 6.09% of the ETF ER 12 Month Revenue projection, which is currently running at a rate of $8.25 billion. Active ETFs represent about $102 billion. It is noteworthy that, at the end of January, 280 ETFs are fully transparent, actively managed ETFs, representing 12.18% of the 2,298. I think this revenue share number will change dramatically over time with the new active wrappers ETF launches. I look forward to more ETF innovation and investment choices. The revenue number is up about 20.6% from $6.83 billion in December 2018.
The Coming Decade
Looking forward to the next decade, note that the Top 20 ETFs in terms of AUM are worth $1,305 trillion cumulatively, as of December 31, 2019, meaning what was launched in the 11-year period between 2009 and 2019 has represented about 30% of the aggregate value of the US ETF market. Moreover, it is not surprising that 73 of the 140 launches in the top 20 in terms of AUM simply compete on price. Vanguard and Schwab launched most of the 29 ETFs back in 2009 and 2010, proving three things: (1) the custodial relationship has value, (2) low price is all you need in a bull market, and (3) scale has advantages. Low cost ETF solutions also found launch success in 2012 and 2018. What was launched those years now represent 85% and 44.4% of the AUM launched that year. However, in this later period (2013-2019), more of the Top 20 AUM success is in ETFs that are providing targeted alpha or access through differentiation. Many of these ETFs are blurring the lines between active and actively managed rules-based strategies and will probably be the focus of future launches in equities, fixed income, and alternative/asset allocation strategies.
Free beta or low-cost beta launched during these past 11 years now represent 16% of the AUM. ETFs such as SPDR S&P 500 ETF (SPY) and Invesco QQQ Trust (QQQ) were launched prior to 2009, would represent about 36% of the total, and are the target of the lowest cost ETFs. This is part of the reason why the asset-based fee at 19 BPS has stayed steady despite all the fee compression. The point is that in the coming decade, I think ETF differentiation will be recognized by investors either with a different message, aka ESG, or because market dynamic change and risk budgeting from active or rules based will play a more important role.

Index performance is for informational purposes only and does not represent any ETF. Indexes are unmanaged and one cannot invest directly in an index. Past performance is NOT indicative of future results, which can vary.
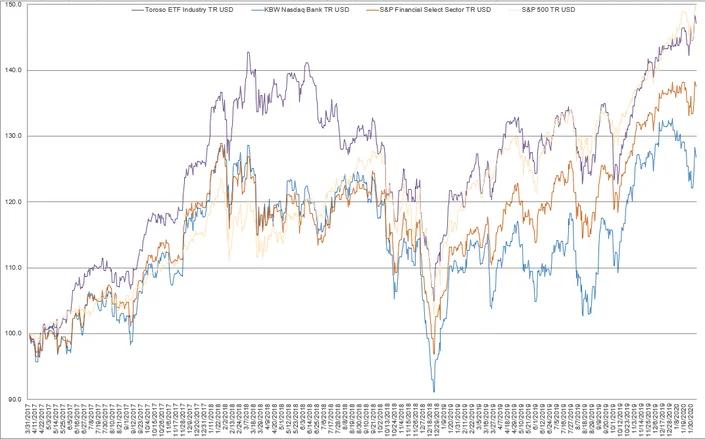
| Returns as of January 30, 2020. Inception Date: April 4, 2017. Index performance is for informational purposes only and does not represent any ETF. Indexes are unmanaged and one cannot invest directly in an index. Past performance is NOT indicative of future results, which can vary. |
| Click here for information on the Index following the ETF industry |