Introduction
Geared markets: When consensus erodes and assumptions grow
The list of things investors can not agree on is growing despite the agreements by market pundits. Consensus can be wrong and when constituencies have different agendas there is the potential to have bifurcating outcomes. In addition, given that everything seems to be negotiated in social media and market liquidity is optimized through ETFs we think market participants should be prepared for volatility. The disconnect can be compared to the divergence between the actual state of our U.S. economy and that of the global market. One thing is clearer than ever; Perspectives matter when approaching any question in deeming an answer to be right or wrong. We’ll get to where we are in the market, but to simplify our message there are five things we would like you to focus on.
1. What is a reserve currency?
2. What will the idea of nations mean in 2050?
3. What is negative yielding debt?
4. What is a debt super cycle?
5. The forgotten workhorse of the global economy. The consumer. How’s the consumer feeling?
Before we get to the questions, let’s talk assumptions, specifically assumptions regarding the middle class. Assumption #1; The middle class has experienced many periods in history with prosperity and growth. In fact, over history, the middle class as often struggled. The last 50 years in the US (or maybe the last 50 minus the last 10) may very well be the outlier and not the norm. Now back to the questions.
1. What is a reserve currency?
Firstly, a currency is paper (or in some instances just a digital) backed by the faith of the government who issues it. A reserve currency, is a currency in which trade is facilitated in, primarily in commodity markets. In non-textbook terms, a reserve currency is something that every nation needs in a worse case scenarios. Assumption #2; The US dollar and in turn US debt will always be in demand from foreign nations. History has shown that the status of a reserve currency often doesn’t last indefinitely even though it may seem so in the present.
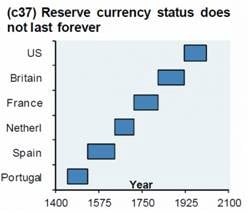
Central banks around the globe are holding a smaller percentage of US dollars. China Russia and Iran are exchanging oil using Chinese futures markets to not use dollars to facilitate trades. In turn they are holding less US treasuries at their central bank. What’s replacing it? That answer varies by nation, but in some instances gold and cryptocurrencies. Facebook even launched its own cryptocurrency called Libra.
2. What is a nation?
Lets play a game and fast forward to 2050. 1 of 4 of us have some sort of computer chip in our head (43% apple, 37% android, 20% other), 2% of us have been to planet Mars (the Tesla side, not China’s – that data is unclear). Is your ID going to be a passport book, card, or passport App? Aren’t we all just members of google, facebook, apple and amazon? Isn’t it strange we are putting the hopes of our planet in terms of its well-being into companies deemed beneficial environmentally, socially and governance wise, a responsibility once fallen primarily on our government?
We relate this to the conversation above on reserve currencies. Whether we trend towards a reserve basket, a cryptocurrency, a metal, or a split world with varying reserve currencies in different trade paths, the US dollars place will be put into question at some point, as will demand for our growing piles of debt.
3. What is negative yielding debt?
Thankfully, no one has yet issued debt with a negative coupon (could be a good way for the US to refill social security?). So what is negative yielding debt then? A bond priced so high, that even after a series of coupon payments and return of principal, the bond holder will receive less than they paid for the bond. If you expect us to now outline why this makes sense for anyone other than a central bank to hold you we apologize for disappointing you. Odds are one of your bond issuance- cap index funds may hold some. There is a whole lot of it (see bloomberg chart below).

For a larger view, please click on the image above.
4. What is a debt supercycle?
“The term debt supercycle refers to a long period of intense and persistent increase in leverage throughout the economy. The term was coined in the 1960s by Montreal based BCA Research and focuses on gains in national debt relative to GDP.†https://www.macquarie.com/dafiles/Internet/mgl/global/shared/corporate/asset-management/investment- management/insights/facing-down-the-debt-supercycle.pdf?v=2
Ray dalio recently released a book called “Principles for Navigating Big Debt Crisesâ€. A few years back he released an economics 101 video called “How the Economic Machine Works†(https://www.youtube.com/watch?v=PHe0bXAIuk0). We recommend watching if you want a better understanding of the markets that be, and the gears that turn them. The cause an effect of a debt supercycle and negative yielding debt can’t be ignored.
5. How’s the consumer feeling?
You are probably sick of hearing about tariff talks and watching the monthly yo-yo of the market’s reaction to them. What are they really fighting over? You. Your dollars, information, spending tendencies, even your face (google face app privacy for more). The consumer. Going back to Assumption #1 (the middle class)… what exactly is todays American dream? To own a home? A stable income stream? Social Security? To own an iphone? With earbuds? How’s that going? What’s different today from 2009? Ok less questions lets talk facts. 10 years since markets bottomed out in the US the US consumer is definitely older. Pretty much all of the developed world has an aging demographic problem. Wages have risen as of late, but the effects of a historic market have hardly boosted the masses in a rising tide sense that many had hoped. The divergence will feel even more drastic in any future (unless the Fed’s wizardly has solved for market corrections?) downturn. The recent weakness of the consumer can be seen below in the Buying Conditions Index.

For years, talking heads and strategies have warned of such geared markets. Are they wrong? Thinking back on where we started, perspectives, consensus and assumptions. Today they are wrong but tomorrow we may say they were right today. Because geared markets stay geared until the hinges fall off. And when you are talking about 80 year debt super cycles and a nation’s status as a global reserve currency, a +/- of 30 years is statistically within reason. We say this reiterating past market commentary thoughts that this is not a call to run and hide. In fact, odds would strongly favor the next recession, whenever that may will not be tied to the total disruption of a debt super cycle and fall of the US dollar as a global reserve currency. That doesn’t mean the cracks in their walls that are forming wont be what causes the after shock that is the ever anticipated, next recession. We are now back in a rate cutting cycle (or mid rate increase “pauseâ€). Europe is back to quantitative easing and the US has begun rolling over bonds that come due (not easing, but no longer allowing their balance to decrease over time).

The roll off of Federal Reserve balance sheet assets ( shown above at 3.8 trillion) will now flatten as the fed hopes to revert the yield curve. It is crucial to remember that much of historical wealth creation occurs during such periods of uncertainty, and not participating would be financially irresponsible. Central banks around the world are banking (pun intended) on investors following through on the tried and true statement; “don’t fight the fed,†but this time, central banks looks far less intimidating.
US EQUITIES
Buybacks continue to drive US equity markets. 2019 looks to be following a similar path to 2018. After a dip in profit margins, S&P 500 margins rebounded remaining just below recent highs.


In addition to expanded profits, the price we are paying for each dollar of sale (while squeezing out as much profit as feasibly possible within each dollar sold) is also teetering near all-time highs. We don’t believe there’s much room for growth in terms of margins. Top line sales growth will need to be strong for US markets to perform outside of buyback and rate cuts (back to how the consumer is feeling…).

The iShares total market ETF (ITOT) & iShares Core S&P 500 ETF (IVV) returned 20.41% & 20.23% through July for 2019. Markets were more temperamental than those number would infer. The iShares S&P Mid Cap (IJH) and iShares S&P Small cap (IJR) returned 19.38% and 14.98% respectively. After starting the year strong in a more traditional growth rally small and mid cap stocks have underperformed. Large cap growth slightly outperformed value, iShares S&P 500 Growth ETF (IVW) returned 21.46% and the iShares S&P 500 Value ETF (IVE) returned 18.66%.

For a larger view, please click on the image above.
After two quarters of terrible performance momentum is back in favor. We continue to move further away from traditional market cap, style box, sector investing in favor of non-traditional intelligent structures or thematic investments to generate outperformance in US markets (the first more so through fully market cycles and the second for higher beta) if you happen to be more defensively positioned.
International Equities
Tariffs & QE
The ECB released further rounds of quantitative easing. Emerging markets swing with each update on global tariffs. We continue to see long term value in unique opportunity sets primarily within emerging markets, trending away from traditional index products in this space. While Europe is cheaply priced from traditional fundamental metrics we are not so confident recent rounds of Quantitative Easing will have similar effects of the past decade. iShares MSCI Emerging Markets ETF (EEM) returned 8.86% YTD through July, up only 0.5% in Q2 and down -1.26% in July. iShares MSCI EAFE ETF (EFA) returned 12.61% YTD through July. EMQQ EM Internet of Things ETF (EMQQ) returned 19.93% through July, down almost 2% since the end of the first quarter. While much more volatile than broader emerging market ETF equities, we expect long term outperformance in this SPACE as the FAANG like names to take their place in global markets as China’s economic engine grows.
Fixed Income
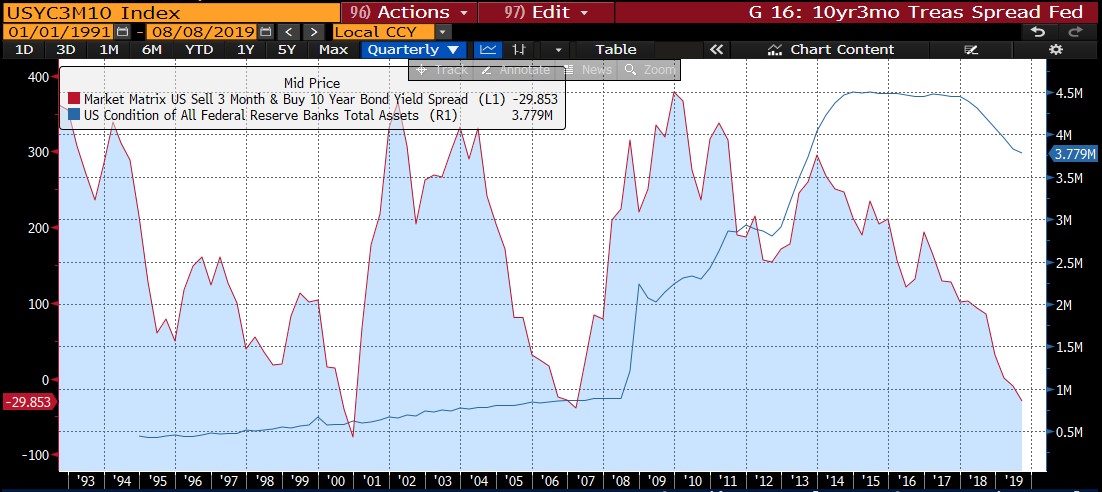

On the right you can see the spread between 3 month and 10 year treasuries (currently negative almost 30 basis points). The blue line on the right chart is the balance of the US Federal Reserve assets. Recent actions by the Fed will flatline this number as they attempt to revert the yield curve. The chart on the left is not a Nike add. This is the US Treasury yield curve.
Similar to the Barclays Aggregate Bond Index, duration in corporate debt has also creeped up. Partially due to QE, and in some form index bond funds have allowed it to occur without any concern. What does this mean? Now more than ever active mangement, or actively managing passive index funds in the fixed income space is very necessary. We at Toroso have been barbelling risks between the short end of the curve and unique structures further out on the furve. Below you can see where BBB spreads are compared to the 10 year (that’s almost 30 bps below 3month treasuries).

For a larger view, please click on the image above.
So 10 year BBB rated debt is yielding 1.47% above 10 year treasuries and ONLY 1.18% more than 3 month treasuries. Pick your fixed income risks wisely. At least its positive yield. We have been implementing the Saba Closed-End Fund ETF (CEFS) for active management in discounted closed-end funds seeking yield at discount when available. At the end of the day investors are seeking defense and income from fixed income, so sprinklying in longer term treasuries alongside opportunitistic income and cash can recreate the attributes of the Barclays Agg investors seek.
Alternatives
The Bloomber Galaxy Crypto Index (BGCI) is up 72% YTD through July after returning -81% or 2018. SPDR Gold Shares (GLD) is up 11.13%, which was flat for the year 3 months ago. After starting the year off strong, commoties have sputtered. The Invesco DB Commodity Tracking ETF (DBC) is up 8.39% through July, down over 1.5% since the first quarter. A shift has definitely occurred in non traditional markets when fear around currencies arise.
Conclusion – flashing signs