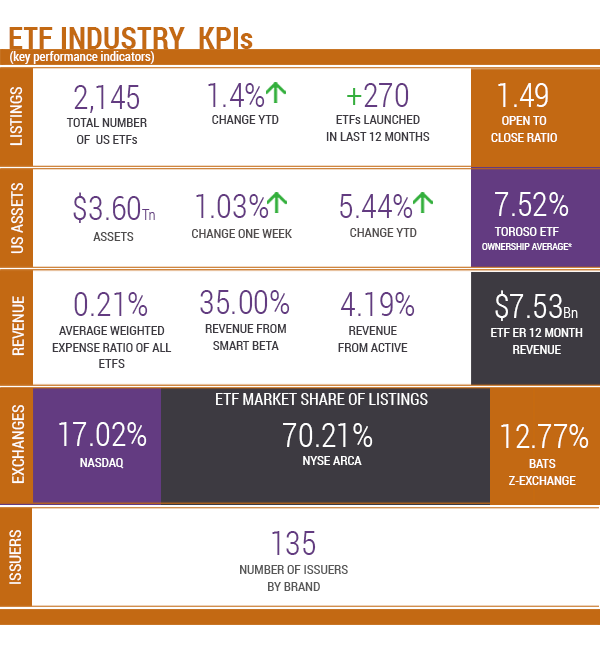
Source of KPIs: Toroso Investments Security Master, as of July 16, 2018
INDEX PERFORMANCE DATA
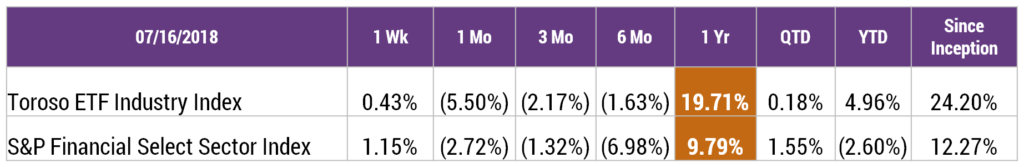
Returns as of July 16, 2018.
Inception Date: April 4, 2017. Index performance is for informational purposes only and does not represent the ETF.
Indexes are unmanaged and one cannot invest directly in an index.
Past performance is NOT indicative of future results, which can vary.
THE SMARTCOST ™ CALCULATOR FOR THE EMERGING MARKETS?
The TETF.Index update takes a different track this week. In breaking down the access to the $168.6 Billion Emerging Markets ETF opportunity, it is clear that security selection across about 70 ETFs matters a great deal. Fees can be as low as 11 Bps for the SPDR MSCI Emerging Market (SPEM) and as high as high as 90 Bps for the Invesco DWA Emerging Market Momentum (PIE), but more important than fee is how investors are “Smart about their Beta” by drilling down in identifying their active share in the index construction. This is why advisors need to be practical with how they manage their portfolio fee allocation. The ETF Think Tank tools like the SmartCost™ calculator were developed to analyze such portfolio issues.
Beyond just fee, ETFs are also about diversification, transparency, and differentiated portfolio construction. To that point, this week we want to share the broad comparison tool from the ETF Think Tank.
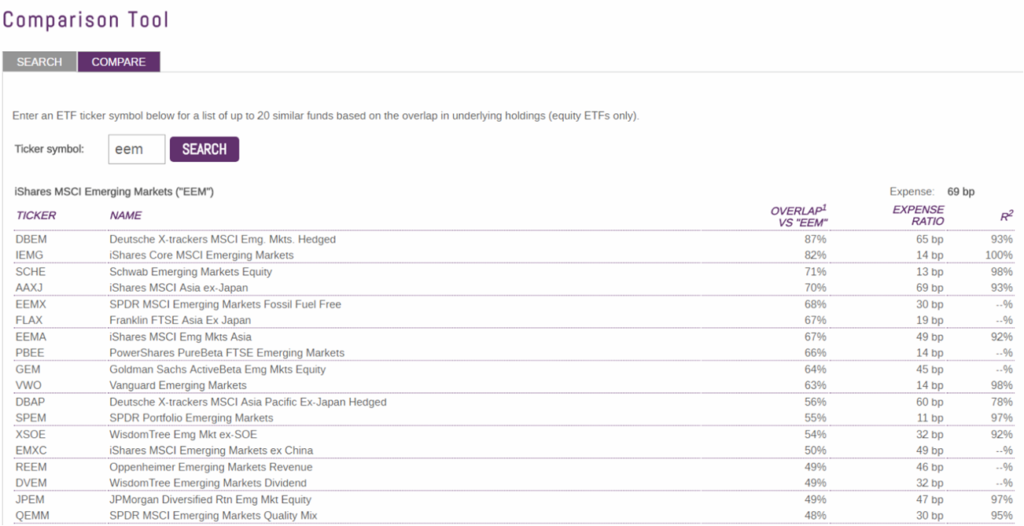
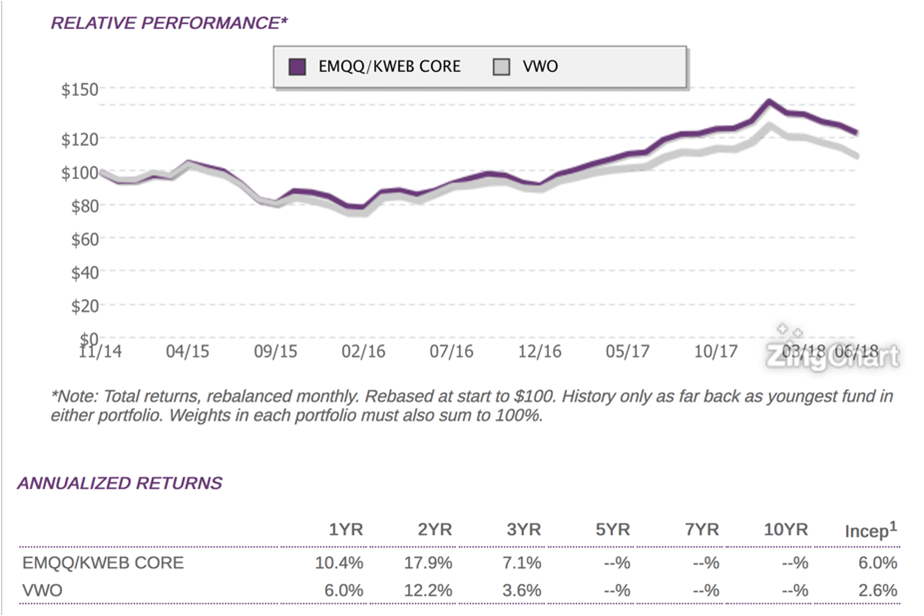
As a quick screen tool provides broadly what ETFs overlap, this is helpful in budgeting fee allocation across a portfolio so that investors can be Smarter about their Beta. Too often allocators focus the most on simply screening in isolation for the lowest cost rather than the full price of the combined cost of what you they are actually paying for. This means that they may not be truly optimizing their fee budget and arbitrarily eliminating newer satellite positions that could create alpha. The key is to know how much fee is allocated per unit of active share, a concept Toroso calls “SmartCost”. The chart below illustrates how we calculate the Smart Cost of EMQQ vs EEM:

Hindsight is 20/20 and the period between November 13, 2014 to July 13, 2018 is an isolated hypothetical illustration that was limited by the launch date of EMQQ; regardless, it does illustrate how wrongly focusing on fees can encumber an investor’s returns. Structure matters a lot more than the expense ratio. In fact, we argue that in using the SmartCost™ Calculator to highlight the diversification across the fee opens the door to the next generation of ETFs which may have a better engine. To illustrate that point, using the ETF Think Tank analyzer, we built a simple Emerging Market portfolio where cost was overall similar vs the Vanguard FTSE Emerging Markets ETF (VWO) and came out with a portfolio that had better returns and had very little overlap with the Vanguard fund (about 57%). Our point was that since we allocated 80% evenly between iShares Core MSCI Emerging Markets ETF (IEMG) and SPDR® Portfolio Emerging Markets ETF (SPEM) and then evenly between the Emerging Markets Internet & Ecommerce ETF (EMQQ) and KraneShares CSI China Internet ETF (KWEB), this kind of wrapped solution would not be difficult to maintain, but offer significantly more diversification. Lastly, assuming that a portfolio is only allocated to emerging markets of between 5-10% the excess return that might come from the incremental addition to the smaller funds could be significant.
The rapid growth of the ETF market place has been driven mostly from cheap, broad access to “markets”, but investors and fiduciaries should not be simply drawn to low cost solutions and ignore those funds with “special sauce.” In more challenging times, we think the next phase of growth will also be about diversification of solutions. We recommend that investors and fiduciaries look to the TETF.Index reports for ideas and solutions as the ETF industry will continue to evolve and grow.
To check out the SmartCost™ Calculator, please sign up for the ETF Think Tank at https://etfthinktank.com/. It is complimentary to qualified advisors.
Additionally, this past weekend, France won the

World Cup, and a few weeks back we had France winning the ETF World Cup!!
ETF LAUNCHES
| AdvisorShares Dorsey Wright Micro-Cp ETF | DWMC |
| AdvisorShares Dorsey Wright Short ETF | DWSH |
| ClearShares Ultra-Short Maturity ETF | OPER |
| ALPS Clean Energy ETF | ACES |
TETF INDEX PERFORMANCE VS LEADING FINANCIAL INDEXES
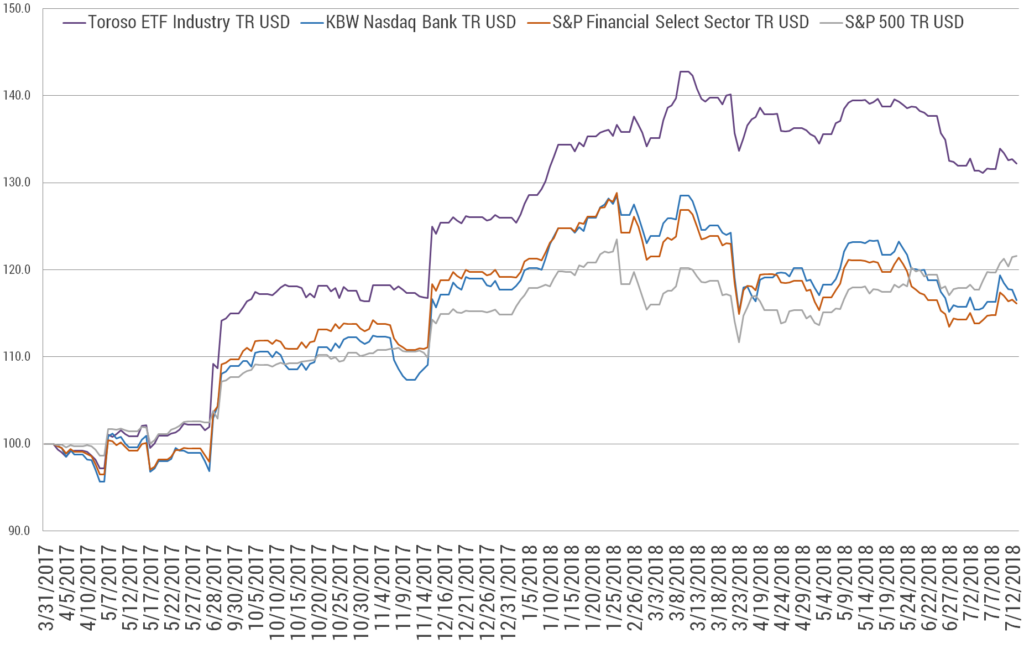
As of July 16, 2018
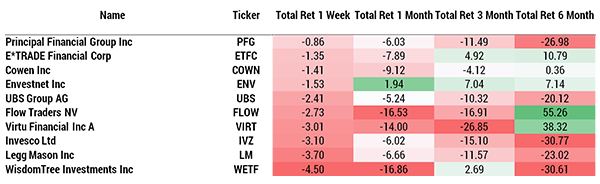
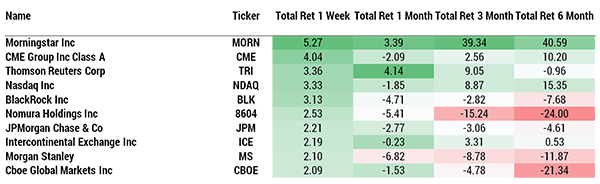
TOP 10 HOLDINGS PERFORMANCE
BOTTOM 10 HOLDINGS PERFORMANCE