Broad Market: GBTC Selling the Wrapper, Not the Asset Class!
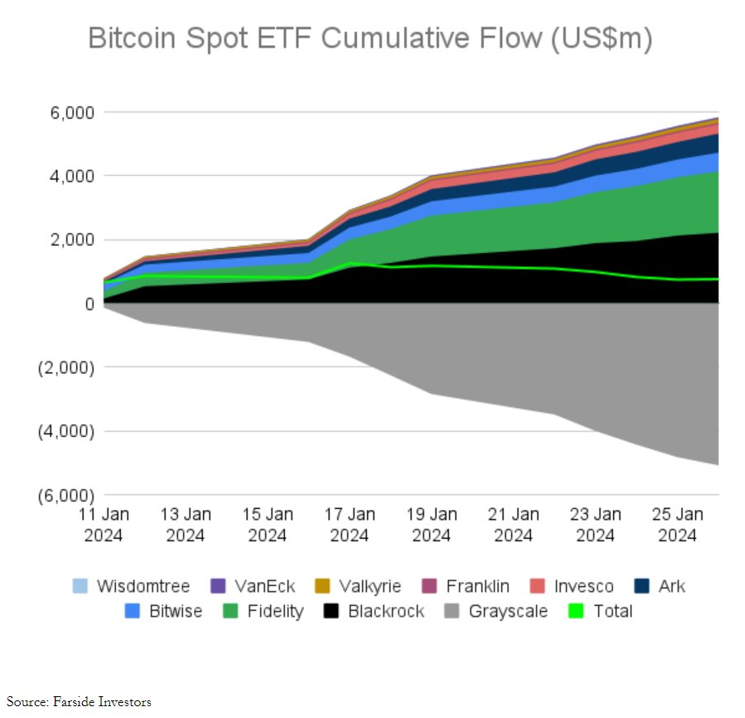
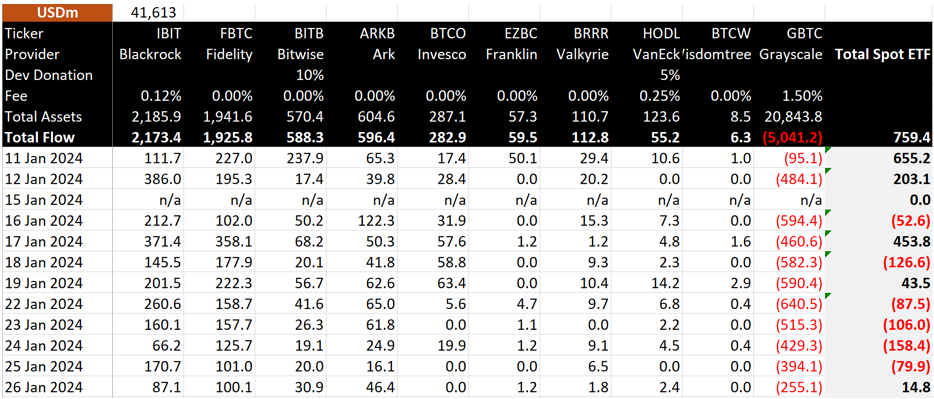
We appreciate that the recent coverage on Spot Bitcoin borders on ad nauseum, so we will be brief while answering a question that seems obvious to us. Why is Bitcoin down? Answer: $5 billion in outflows from the Grayscale Bitcoin Fund (GBTC). When will the selling stop?
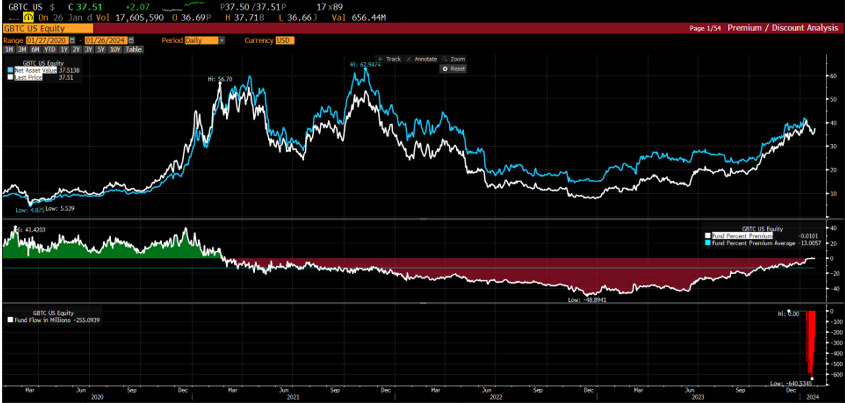
- In 2022, many investors bought the Grayscale Bitcoin Fund (GBTC) hoping for a 20 to 49% discount to the fund narrowing, so in 2024, many have left and declared a home run victory. This opportunity reflects the failure of that wrapper prior to its conversion to an ETF. Moreover, those who bought GBTC prior to 2022 when it traded at a premium may have been sellers, as their capital is no longer held hostage. Exactly what percent of the 136 million shares are held by these folks is difficult to know, but it would be reasonable to assume a majority.
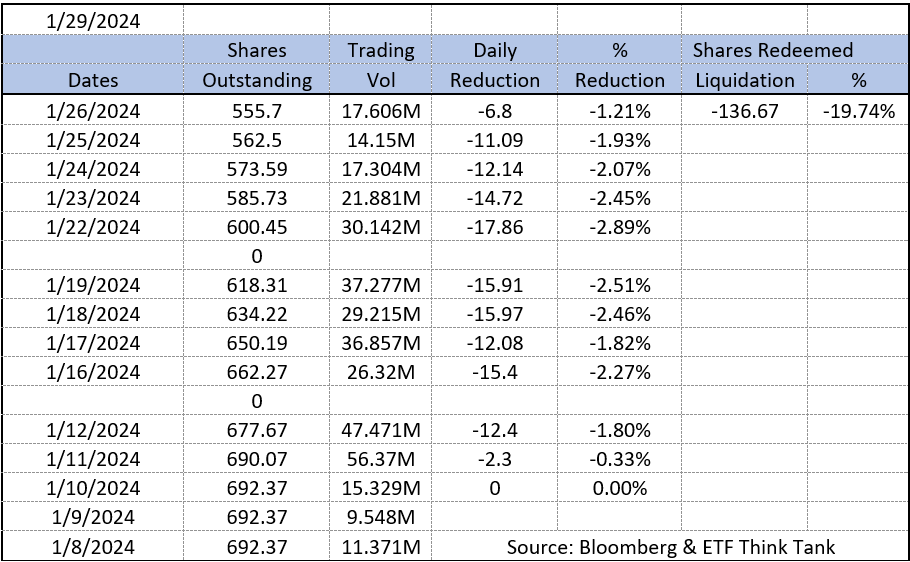
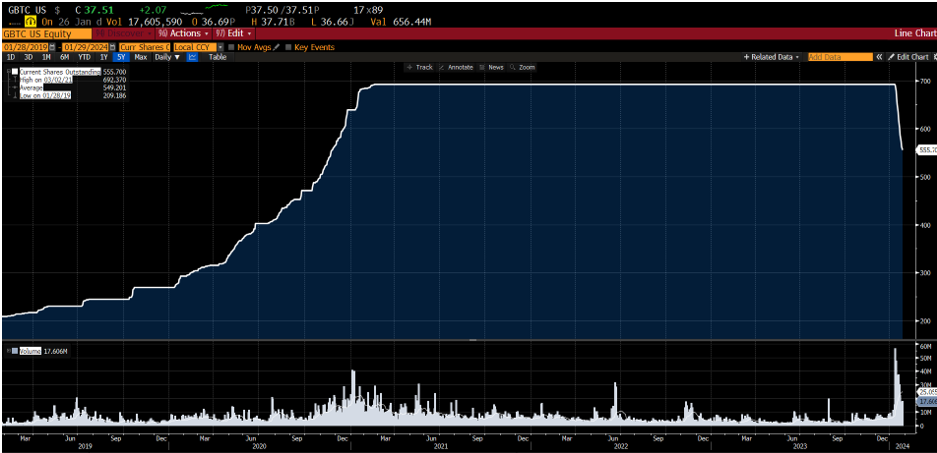
- You can track the trade unwind as the static share count of the Grayscale Bitcoin Fund (GBTC) collapses, going from 692,370,000 shares outstanding on March 1, 2021, to 555,700,000 on January 26, 2024. While some people seem to be shocked that 9 ETF launches could absorb so much Bitcoin selling, we would argue that this is a credit to the ETF wrapper. How else could $5 billion worth of assets get liquidated in 12 days? Yes, we would also note that net flows are positive, at $759 million, but buyers and sellers are not getting their Bitcoin crossed neatly through block trades. Moreover, we would argue that the good news about this price action is that it has been very orderly, with about 2-3% shrinkage per day. Since Jan 10th, the share count has shrunk by about 20% (see Share Count Chart below). Note that since the ETF Spot conversion, 136,670,000 GBTC shares have been redeemed (destroyed), which means Bitcoin came on the market.
Additional selling has come from various sources, including the liquidation of bankrupt exchange FTX, but we think it is reasonable to assume that the 20% decline of the outstanding GBTC shares contributed most to the negative direction. It is likely that another 20% is waiting to see if the fee gets more competitive, and perhaps some percent are just holding on for tax reasons. Of course, this is the bet that the Digital Currency Group (DCG) is making. An ETF with $15 billion at a 1% to 1.5% fee would be a massively profitable product, with a run rate of about $150 million to $225 million! Remember, there aren’t a lot of moving parts on this fund, so as a business its profitability could fund a great deal of innovation in the space! Options are also likely to appeal to some traders in the space, and liquidity of GBTC will drive the options market. We believe that short-term buying, trading, and shorting will be dominated by GBTC which, of course, is wonderful for them and for the overall market. DCG is also now debt-free with about 100 employees, so they will continue to be a formidable competitor for everyone and spend millions on advertising and education. For fun, we are thinking (hoping) GBTC share counts stabilize at the magic number of 444,444,444 with Bitcoin priced at $44,444. This would mean an asset value of about $19.7 billion.
Where are we going with this rambling? We would expect a big victory lap around the institutional access that Spot Bitcoin ETFs provide if some $5 billion more shares are neatly redeemed out of GBTC around current levels. This could mean a rally into the halving and further confidence that demand will be absorbed from the Mt Gox liquidation later this year. Most importantly, observers can easily watch all this progress in the share count of GBTC as well as the other funds that now trade and offer spot Bitcoin access.
Are $DIG and $DUG two fun tickers? In the ETF industry, great tickers can often $RISE (liquidated) to the top of the heap, but they don’t aways $FILL the void in a portfolio since they can also be a slow $DRIP as an allocation. In the case of energy stocks and commodities, the slow drip has often been the case. Moreover, any overweighted allocation close to 5% vs. the S&P 500 3.78% allocation would remain mostly meaningless unless it is very well timed or draws from the extremely high 30% exposure that the technology sector has in the S&P 500.
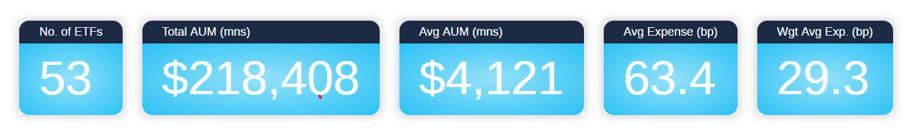
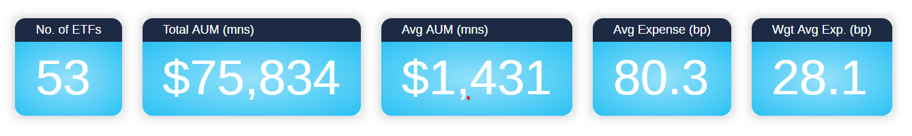
Ironically, in a twist of fate, both the technology sector and the energy sector have 53 ETFs listed in the ETF Think Tank. How about that odd KPI? Yes, meaningless, but probably not so coincidental is the fact that there is $218.4 billion invested in technology ETFs versus the $75.8 billion that is invested in energy. To some degree, this number is surprisingly high. It is greater than the consumer discretionary sector ($30 billion), the consumer staples sector ($26 billion), the utility sector and the communications services sector (both of which are at about $21 billion). MLPs are a subsector of energy and amount to about $16 billion across 16 funds; another coincidence in round numbers.
Hidden Gems
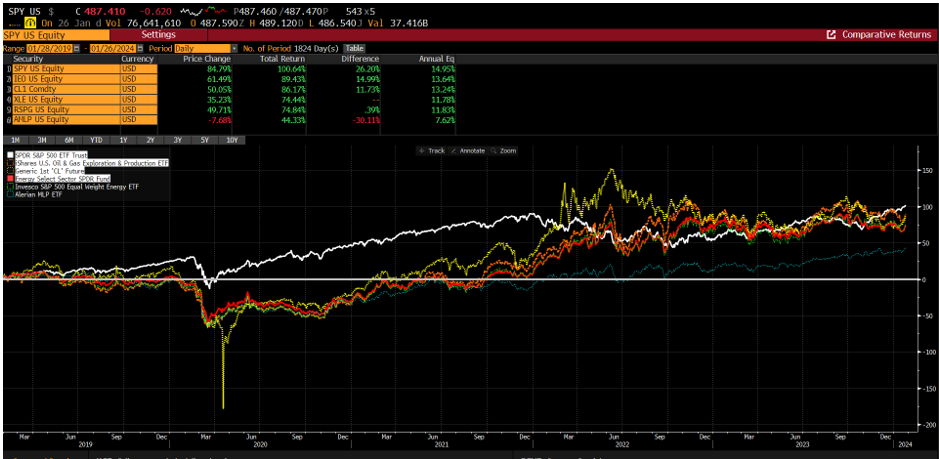
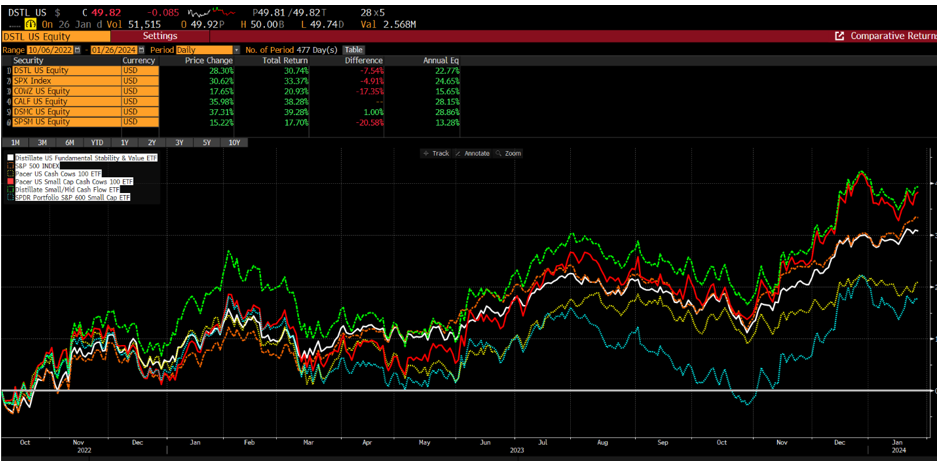
In this section, we always like to highlight a particular ETF in the category, because the largest fund is not always the best fund. In this category, the Energy Select Sector SPDR® ETF (XLE) represents about 45% of the category assets, or $34.2 billion. (see link to ETF Think Tank Tool for details). Members of the Tank should also be aware that they can screen through all 53 funds to compare yield, returns, and Sharpe ratios. The Comparison Tool is also useful to highlight what ETFs have an overweighted position in energy, but this requires some experience in the ETF market. The Pacer US Cash Cows 100 ETF (COWZ) has success in its tilt towards energy. You can see this using the tool when a series of ETFs like FTXN, FXN, DRLL, and IYE all overlap COWZ by about 26%.
The Pacer US Cash Cows 100 ETF (COWZ), with almost $19 billion in assets, represents about 52% of the firm’s total assets and led to the firm’s product extension called US Small cap Cash Cows 100 ETF (CALF) (Inception June 19, 2017). Note that CALF, at 5%, does not overweight energy to the same degree as COWZ. We have often written about the Distillate Fund family and how these two firm’s products complement each other. Our concern about COWZ remains that its energy tilt is not always appreciated as a risk by financial advisors. Energy does not always screen well in terms of quality and free cash flow since much of the cash flow is needed to maintain the asset base. This is why we find it particularly curious to see DSMC at an 8% weighting versus CALF at 5%.
Summary
We hope these ramblings are helpful to our ETF Think Tank members. Key takeaways from this piece include:
- Watch GBTC share count lead to another $5 billion of outflows and then bottom out at 444,444,444 shares outstanding and a price of $44,444 on Bitcoin. This price action, of course, requires that the rivalry between the other Spot ETFs in the market continue to draw inflows, or that additional sponsors take on a different twist and launch.
- The energy sector is often underweighted for good reason. With the sector at under 4%, there is no reason to overweight the commodity, except of course if you believe inflation is going to spike up again or the price of energy will independently rally back because of a shortage. Regardless, know your energy exposure, as it may pop up in funds that surprise you.
Thanks for reading! See you at Exchange ETFs from February 11-14th. Those looking for passes should check out the Events section on our website, https://etfthinktank.tidalfinancialgroup.com/events/, or reach out to Dan Weiskopf at dweiskopf@tidalfg.com.
Disclosure
All investments involve risk, including possible loss of principal.
The material provided here is for informational purposes only and should not be considered an individualized recommendation or personalized investment advice. The investment strategies mentioned here may not be suitable for everyone. Each investor needs to review an investment strategy for his or her own particular situation before making any investment decision.
All expressions of opinion are subject to change without notice in reaction to shifting market conditions. Data contained herein from third-party providers is obtained from what are considered reliable sources. However, its accuracy, completeness, or reliability cannot be guaranteed.
Examples provided are for illustrative purposes only and not intended to be reflective of results you can expect to achieve.
The value of investments and the income from them can go down as well as up and investors may not get back the amounts originally invested, and can be affected by changes in interest rates, exchange rates, general market conditions, political, social, and economic developments, and other variable factors. Investment involves risks including but not limited to, possible delays in payments and loss of income or capital. Neither Tidal nor any of its affiliates guarantees any rate of return or the return of capital invested. This commentary material is available for informational purposes only and nothing herein constitutes an offer to sell or a solicitation of an offer to buy any security and nothing herein should be construed as such. All investment strategies and investments involve risk of loss, including the possible loss of all amounts invested, and nothing herein should be construed as a guarantee of any specific outcome or profit. While we have gathered the information presented herein from sources that we believe to be reliable, we cannot guarantee the accuracy or completeness of the information presented and the information presented should not be relied upon as such. Any opinions expressed herein are our opinions and are current only as of the date of distribution, and are subject to change without notice. We disclaim any obligation to provide revised opinions in the event of changed circumstances.
The information in this material is confidential and proprietary and may not be used other than by the intended user. Neither Tidal nor its affiliates or any of their officers or employees of Tidal accepts any liability whatsoever for any loss arising from any use of this material or its contents. This material may not be reproduced, distributed, or published without prior written permission from Tidal. Distribution of this material may be restricted in certain jurisdictions. Any persons coming into possession of this material should seek advice for details of and observe such restrictions (if any).