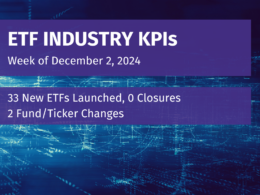
Week of September 12, 2022 KPI Summary
- This week, the industry experienced 19 ETF launches and 4 closures, shifting the 1-year Open-to-Close ratio to 3.47 and total US ETFs to 3,020.
- Football season is back for College Football and NFL fans alike. Yesterday in the NFL, there were 3 historic comeback victories by the Arizona Cardinals, Miami Dolphins, and New York Jets. Sportsbooks had Dolphins and Cardinals as long as 25-1 late in the games with the Jets even 175-1! This got us thinking, which ETFs have had a comeback performance lately?
- Of the 100 worst performing ETFs from 2021, 47 have positive change in 2022 YTD. As you can imagine, 40 of the 47 are Inverse ETFs with the remaining being leverage (3) and Exposure equities (4).
- The best performing Inverse ETF of the group is Direxion Daily Dow Jones Internet Bear 3X ETF (WEBS) at 109.4% change. The best performing Equity YTD is iShares MSCI Turkey ETF (TUR) at 33.1% change. Lastly, the top Leveraged ETF YTD is MicroSectors™ US Big Banks Index 3X Inverse Leveraged ETN (BNKD) at 15.4%.
- Of the 100 worst performing ETFs of 2022 YTD (ranging -100% to -46%):
- Only 3 have positive performance over the past month.
- The top comeback ETF by far is ProShares UltraShort Bloomberg Natural Gas (KOLD) in this category at 28.3% 1-month, yet -94.6% YTD.
- Surprisingly, 58 of the 100 have had positive change over a 3-month time period.
- This category is pretty evenly split between Geared/Swaps and Equity ETFs.
- Top performing Geared/Swaps ETF is Direxion Daily S&P Biotech Bull 3X ETF (LABU) at 86.4%.
- Top performing Equity is First Trust SkyBridge Crypto Industry and Digital Economy ETF (CRPT) at 21.4%.
- This category is pretty evenly split between Geared/Swaps and Equity ETFs.
- Only 3 have positive performance over the past month.
- Of the 100 worst performing ETFs from 2021, 47 have positive change in 2022 YTD. As you can imagine, 40 of the 47 are Inverse ETFs with the remaining being leverage (3) and Exposure equities (4).
- It’s been a difficult year for ETF performance across various segments, but comeback stories – historic performance or otherwise – are real and fun to see.
- The tracked indexes had a negative change last week. The Toroso ETF Industry Index was down -4.93% while the S&P Financial Select Sector Index led at -3.77%.

ETF Launches
KraneShares S&P Pan Asia Dividend Aristocrats ETF (ticker: KDIV)
Carbon Strategy ETF (ticker: KARB)
Main BuyWrite ETF (ticker: BUYW)
Newday Sustainable Development Equity ETF (ticker: SDGS)
THOR Low Volatility ETF (ticker: THLV)
AB Tax-Aware Short Duration ETF (ticker: TAFI)
AB Ultra Short Income ETF (ticker: YEAR)
BondBloxx Bloomberg Five Year Target Duration US Treasury ETF (ticker: XFIV)
BondBloxx Bloomberg One Year Target Duration US Treasury ETF (ticker: XONE)
BondBloxx Bloomberg Seven Year Target Duration US Treasury ETF (ticker: XSVN)
BondBloxx Bloomberg Six Month Target Duration US Treasury ETF (ticker: XHLF)
BondBloxx Bloomberg Ten Year Target Duration US Treasury ETF (ticker: XTEN)
BondBloxx Bloomberg Three Year Target Duration US Treasury ETF (ticker: XTRE)
BondBloxx Bloomberg Twenty Year Target Duration US Treasury ETF (ticker: XTWY)
BondBloxx Bloomberg Two Year Target Duration US Treasury ETF (ticker: XTWO)
OneAscent Emerging Markets ETF (ticker: OAEM)
OneAscent International Equity ETF (ticker: OAIM)
Strive 500 ETF (ticker: STRV)
Hashdex Bitcoin Futures ETF (ticker: DEFI)
ETF Closures
AdvisorShares North Square McKee ESG Core Bond ETF (ticker: MENV)
Premise Capital Diversified Tactical ETF (ticker: TCTL)
JPMorgan US Minimum Volatility ETF (ticker: JMIN)
JPMorgan US Dividend ETF (ticker: JDIV)
Fund/Ticker Changes
None
TETF.Index Performance vs. S&P Financial Select Sector Index
(as of September 16, 2022)

TETF.Index Performance vs. Other Leading Financial Indices
(March 31, 2017 through September 16, 2022)

Source: Morningstar Direct
Why Follow the ETF Industry KPIs
The team at Toroso Investments began tracking the ETF Industry Key Performance Indicators (KPI’s) in the early 2000’s and have been consistently reporting on, and analyzing these metrics ever since. The table above was the impetus for the creation of the TETF.Index, the index that tracks the ETF industry. Each week, we will share the statistics we believe to be the most useful for identifying industry trends, in addition to the performance of the TEFT.Index.
DISCLAIMER
Past performance is no guarantee of future returns. This article is for informational and educational purposes only; is not intended to constitute legal, tax, accounting or investment advice; and does not constitute an offer to sell or a solicitation of an offer to buy any security or service. Furthermore, the Indexes shown above are not investable. While Toroso has gathered the information presented from sources that it believes to be reliable, Toroso cannot guarantee the accuracy or completeness of the information presented and the information presented should not be relied upon as such. Any opinions expressed are Toroso’s opinions and do not reflect the opinions of any affiliates or related persons. All opinions are current only as of the date of initial publication and are subject to change without notice. All investment strategies and investments involve risk of loss, including the possible loss of all amounts invested.


