Week of January 18, 2021 KPI Summary
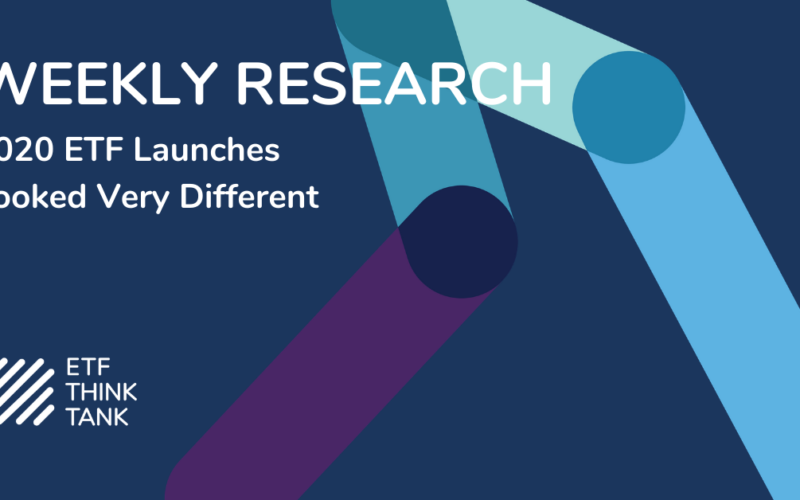
This week, there were 7 new ETF launches, coupled with 11 ETF closures. This brought the Open-to-Close ratio down a bit, from 0.99 to 0.97. Total US ETFs stands at 2,325 now, down 3 from last week. Though the number of ETFs decreased slightly, US ETF assets increased by 1.64%, climbing from $5.58 Tn to $5.67 Tn. ETF expense ratio revenue followed suit, jumping from $10.14 Bn to $10.45 Bn, 9.41% of which is from active ETFs. For a review of how launches in 2020 looked very different from the over-all ETF industry check out this article: 2020 ETF Launches Looked Very Different.

ETF Launches
American Century Low Volatility ETF (ticker: LVOL)
FT Cboe Vest US Equity Buffer ETF January (ticker: FJAN)
FT Cboe Vest US Equity Deep Buffer ETF January (ticker: DJAN)
FT Cboe Vest Fund of Deep Buffer ETFs (ticker: BUFD)
FT Cboe Vest Gold Tactical Buffer ETF (ticker: BGLD)
ProShares Ultra Cloud Computing (ticker: SKYU)
ProShares Ultra Nasdaq Cybersecurity (ticker: UCYB)
ETF Closures
UBS ETRACS CMCI Food Total Return ETN (ticker: FUD)
UBS ETRACS CMCI Agriculture Total Return ETN (ticker: UAG)
UBS ETRACS CMCI Gold Total Return ETN (ticker: UBG)
UBS ETRACS CMCI Total Return ETN (ticker: UCI)
UBS ETRACS CMCI Silver Total Return ETN (ticker: USV)
UBS ETRACS Bloomberg Commodity Total Return ETN (ticker: DJCI)
UBS ETRACS Wells Fargo Business Development Co ETN (ticker: BDCS)
Barclays Inverse US Treasury Aggt ETN (ticker: TAPR)
Barclays ETN+ FI Enhanced Europe 50 B (ticker: FLEU)
Barclays ETN+ FI Enhanced Europe 50 C (ticker: FFEU)
Barclays ETN+ FI Enhanced Global High Yield B (ticker: FIYY)
TETF.Index Performance vs. S&P Financial Select Sector Index
(as of January 22, 2021)

TETF.Index Performance vs. Other Leading Financial Indices
(March 31, 2017 through January 22, 2021)

Why Follow the ETF Industry KPIs
The team at Toroso Investments began tracking the ETF Industry Key Performance Indicators (KPI’s) in the early 2000’s and have been consistently reporting on, and analyzing these metrics ever since. The table above was the impetus for the creation of the TETF.Index, the index that tracks the ETF industry. Each week, we will share the statistics we believe to be the most useful for identifying industry trends, in addition to the performance of the TEFT.Index.
DISCLAIMER
Past performance is no guarantee of future returns. This article is for informational and educational purposes only; is not intended to constitute legal, tax, accounting or investment advice; and does not constitute an offer to sell or a solicitation of an offer to buy any security or service. Furthermore, the Indexes shown above are not investable. While Toroso has gathered the information presented from sources that it believes to be reliable, Toroso cannot guarantee the accuracy or completeness of the information presented and the information presented should not be relied upon as such. Any opinions expressed are Toroso’s opinions and do not reflect the opinions of any affiliates or related persons. All opinions are current only as of the date of initial publication and are subject to change without notice. All investment strategies and investments involve risk of loss, including the possible loss of all amounts invested.