ETF NERD TRIVIA |
Question 1
Which Equity ETF has the most unique active share; meaning has the least overlap to any other ETF?
|
Question 2Which US Equity ETF is the most concentrated by holdings, sector, and market cap?
|
Question 3Which US Equity ETF has the most influence on the underlying stocks in the fund when experiencing significant flows?
|
|
|
|
Alright ETF Nerds, write down your answers and prepare to be graded. We will offer a bonus question at the end as part of the answer to number 5. Remember, great research, content, and tools for answering questions like these are always available at www.etfthinktank.com. |
|
|
Answer – Question 1Which Equity ETF has the most unique active share, meaning has the least overlap to any other ETF?
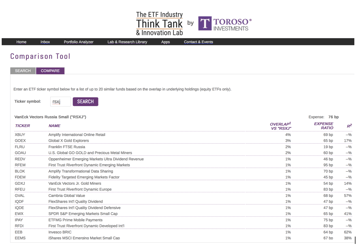
C – RSXJ VanEck Vectors Russia Small
RSXJ only has 3.7% overlap to any other ETF; surprisingly, that 3.7% overlap is to XBUY Amplify International Online Retail. We used the ETF Think Tank Comparison Tool to find this unique ETF. |
 |
|
As we look forward through the top ten highest active share ETFs below, most are single country ETFs without competitors. IPKW and BJK are interesting because they span multiple geographies but remain distinct. |
 |
Answer – Question 2Which US Equity ETF is the most concentrated by holdings, sector, and market cap?
B – IYZ iShares Dow Jones Telecom
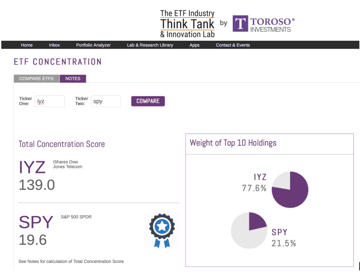
Using the ETF Think Tank Concentration Tool, we reviewed 1303 equity ETFs and using the Hirschman Herfindahl index score to measure position, sector, and market cap concentration. IYZ scored a whopping 139 for our concentration formula. To put that in context, 99% of ETFs score below 100 and SPY comes in at 19. |
 |
|
Bonus Fact: TLTD FlexShares Mngstr Developed Mkts ex-US Factor Tilt scored 6.51, making it the most diversified US listed ETF. |
Answer – Question 3Which US Equity ETF has the most influence on the underlying stocks in the fund when experiencing significant flows?
A – XSHD PowerShares S&P Small Cap High Div Low Volatility
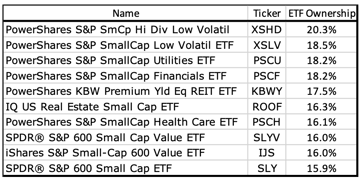
The ETF Think Tank defines ETF influence based on the percentage of the market cap of the underlying holdings owned by ETFs. In every ETF Think Tank research note, we share our ETF Industry KPIs including the ETF ownership influence average for all ETFs, which is currently at 6.9%. This means that, on average, ETFs own 6.9% of the market of every US stock.
When it comes XSHD, on average, the underlying holdings are 20.3% owned by ETFs. This implies large flows will have more influence on the valuation and prices of the underlying holdings. The ETF Think Tank Ownership Influence Tool allows advisors to see the percent of the market cap of any equity owned by ETFs.
As we look below at the top 10 greatest ETF ownership scores, a commonality arises with small caps, high dividends, and REITs. |
 |
Answer – Question 4How many US Listed ETFs own BP ADR?
A – 4
Ok, so this one was tricky; BP is actually held by 108 ETFs. Based on holdings data, 4 ETFs hold the “ADR†and an additional 104 ETFs own the ordinary shares trading in London. The lesson here, when looking under the hood, advisors need to be precise. Many international equities are held in different share types and mixing ETFs can create unforeseen concentrations. Also, something as clear cut as BP, a large cap energy company, can be a top position in some surprising themes. BP is actually a top position in CVY and many other yield focused ETFs as well as KOIN, an ETF focused on Blockchain. |
Answer – Question 5What equity is held by the greatest number of ETFs?
D – PG Procter & Gamble
PG is held by 197 ETFs representing 6.14% of its market cap. PG has a high yield and low volatility making popular with two key factors, but also finds a home in most value-oriented ETFs. |
|
|
Bonus QuestionWhat equity is held by the greatest number of Mutual Funds?
AnswerMSFT Microsoft
Microsoft is held by 846 Mutual Funds, representing 20.63% of its market cap. In contrast, MSFT is owned by 188 ETFs, representing 6.16% of its market cap. We believe the mutual fund number is skewed by MSFT, being often considered both a growth and value stock as well as high ESG scores.
Did You Pass?
Can you stump us with an ETF Nerd question? In thinking through these questions, we hope you contact us to register for the ETF Think Tank where you will gain free access these tools and apply them to meet your needs. Our mission is to help investors easily evaluate and navigate the shifts in the growing ETF Industry. |
|
|
TETF.Index Performance |
 |
|
Returns as of June 10, 2019. Inception Date: April 4, 2017. Index performance is for informational purposes only and does not represent the ETF. Indexes are unmanaged and one cannot invest directly in an index. Past performance is NOT indicative of future results, which can vary. |
|
|
TETF.Index Performance vs. Leading Financial Indexes |


