March 15, 2019
Did $3.3 Billion in REIT ETF Flows Follow the SmartCost™ Calculator?
Thank you Eric and Scarlet for covering this story about REIT flows. As you point out on your ETF IQ show, REIT flows are highly correlated with interest rates so money going into the space after the Fed decided to pause should not be a surprise. Nevertheless, I have to admit, in hindsight I wish I had caught the big move in the space. According to Bloomberg YTD, as of March 13, 2019, the Vanguard Real Estate VNQ is up 15.37%; only surpassed by the Real Estate Select SPDR ETF (XLRE) at 15.52%. By the way, congrats to Virtus for capturing the trend with the launch of the Virtus Real Estate Income ETF (VRAI) on February 8, 2019. Timing the launch of an ETF can be a critical component to success and getting to $186 million in AUM defines a strong launch.

Flows are concentrated among 3 funds so being different is important:
While the $3.3 Billion in headline catches the eye, it is noteworthy that $2.482 Billion flows were concentrated in VNQ and IYR which as our Tank tool points out have an 80% overlap. By the way – with all this chatter about fee wars – why IYR is still charging 44 Bps confounds me? Of course, why should they lower the fee when $1.1 Billion came into the fund this past year. Wait -VNQ isn’t even the cheapest fund. Investor “cheapskates” looking for a bargain might check out FREL (No the symbol FREL does not stand for Free Real Estate Land? Sorry Fidelity for the bad compliance joke – FREL is the symbol for the Fidelity Real Estate ETF. I think they had to price the fee at 8 Bps because their symbol was so bad.)
Back to Virtus (VRAI) and the Virtus Real Asset Income ETF. Having a different take in a crowded space is important to successful ETF launches. There are 25 REIT ETFs and competing against the Vanguard (VNQ) at 12 Bps is tough. VNQ has $33.6 Billion in AUM so this is a hard battle to fight. VRAI charges 55 Bps, but takes on this challenge through an intriguing index approach that focuses on income producing U.S. equities in three categories: real estate, natural resources and infrastructure. Thus, as illustrated below, the overlap between the larger and cheaper funds is minimal. In fact, as the Think Tank Smart Cost Calculator points out – with only a 7% overlap to VNQ investors are paying more for something that is meaningfully different. Skeptics may argue that VRAI is not really a REIT ETF and with REIT holdings only at about 30% they may be right. Nevertheless, ETFs for us are about innovation and accessing solutions, so we are intrigued by this take on the theme.


In 2019, I hear much about fee wars and less about the label “Smart Beta”. I think this is a good thing. Getting a consensus to embrace this stupid label was wrong, but certainly we can all agree that defining cost can be “Smart”. To that point, in the case of IYR, I highlight that the 80% overlap to VNQ allows only for a 20% allocation to what is different. Is a 20% overlap really worth almost triple the fee? I don’t think so. I am surprised that investors with $1.129 Billion thought it was okay. I think we can all agree that the market is a voting machine so what’s with this decision? IYR is a $4.89 Billion AUM ETF.
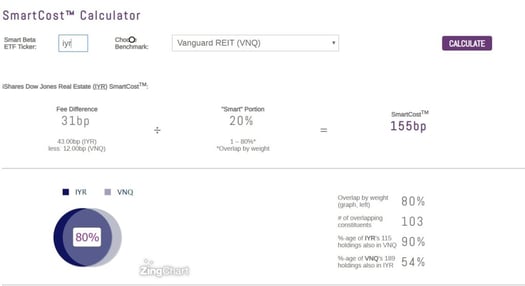
Again, as an ETF Nerd, we encourage the industry to define what is Smart in terms of Cost rather than Beta and in our ETF Think Tank due diligence call with financial advisers we highlight the issue through the SmartCost ™ calculator.
Enjoy the market battle!


