
There are many factors driving the growth in the ETF industry. At Toroso, we believe that those factors can be bifurcated into two categories:
1. INNOVATION FACTORS: Growth is driven by ETFs that provide unique access, exposures or structures as well as inventive revenue models. Those factors are clear when we look at the key milestones in the history of the ETF industry.
2. CLIENT ALIGMENT FACTORS: Those related to the characteristics of ETFs as investment vehicles that are better aligned with client goals: low-cost, tax efficient, liquid and transparent. In other words, ETFs are growing because they better address the needs of investors and clients.
Every week we showcase a few Key Performance Indicators (KPIs) that aim to reflect the growth of the ETF ecosystem. We sight AUM growth, ETF launches and our proprietary metric, the Toroso ETF ownership average (the percentage on average that any US stock is owned by US ETFs).
Every week we showcase a few Key Performance Indicators (KPIs) that aim to reflect the growth of the ETF ecosystem. We sight AUM growth, ETF launches and our proprietary metric, the Toroso ETF ownership average (the percentage on average that any US stock is owned by US ETFs).
In this week’s TETFindex update, we look at a new range of insightful metrics that stem from the analysis of one of the innovations that drove growth in the ETF industry over the last 20 years: the family of sector ETFs launched by State Street (Ticker: STT), a Tier A constituent of our TETF Index.
At Toroso we use SPDR Sector ETFs primarily in our Sector Opportunity Strategy. Click Here to see the Fact Sheet.
As you can see from the timeline above, in 1998 SPDR launched the first US sector ETFs. Today that family of 10 US sector funds has over $130 billion in assets:
% OF SECTOR SPDR ASSETS
% OF S&P500 MARKET CAP
This first chart shows a breakdown of those $130 billion in assets by sector fund. Those percentages are actually quite different from their corresponding market weight in the S&P 500, as outlined in the second chart. The data from both charts imply that when using SPDR ETFs, investors are overweighting Financials, Energy & Utilities while underweighting Technology and Consumer sectors.
In this next chart we utilized our ownership influence software to evaluate which sectors have, on average, the most ETF ownership of the underlying companies’ equity. So for example, when looking at XLK, we calculated that on average, 4.1%, of the market cap of the technology sector stocks are owned by ETFs.
ETF OWNERSHIP
The whole story becomes quite illuminating when the three charts are combined below:
ETF OWNERSHIP AVG. RANK VS S&P500 MARKET WEIGHT RANK VS SPDR SECTOR ASSETS RANK
As you can see, Real Estate (XLRE) and Utilities(XLU) are the sectors most influenced by ETF ownership. While Technology (XLK) is the biggest sector with the best performance this year, it is actually the least influenced by ETF ownership.
Another strange phenonom is the overwhelming amount of assets under management currently in Financials (XLF) with a relatively moderate score for ETF ownership influence and market weight in the S&P 500.
We decided to embrace the transparency of ETFs even further and look at all sector ETFs by issuer. The breakdown of sector ETFs’ AUM by issuer is portrayed in the chart below:
SECTOR ETF AUM BREAKDOWN BY ISSUER
As you can see, SPDR still dominates with 51% market share but Vanguard is not far behind and accelerating mainly due to the success of their Real Estate ETF (VNQ), a fund with approximately $35 billion in assets as of the date of this weekly update.
By looking at the entire universe of Sector ETFs, we see a much higher correlation of ETF ownership influence to Sector AUM especially in Real Estate. There is also more similarity between Sector AUM and the Sector Market Weight in the S&P 500 for Financials but the two hot performers, Health Care and Technology, are still surprisingly underweighted.
ETF OWNERSHIP AVG. RANK VS S&P500 WEIGHT RANK VS ALL SECTOR ASSETS RANK
The information derived from embracing the transparency of ETFs can help generate multiple trading and allocation ideas contributing to the continued growth of the TETFindex Ecosystem.
ETF LAUNCH OF THE WEEK
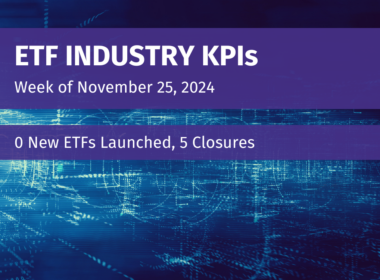
There were no launches this week due to the Thanksgiving holiday; we hope you had a wonderful time with your family.
TETF INDEX PERFORMANCE Vs. LEADING FINANCIAL INDEXES
UNDERLYING TOP/BOTTOM 10 HOLDINGS PERFORMANCE
ETF AND MUTUAL FUND – AUM & FLOWS (IN BILLIONS)
YEARLY ESTIMATED SALES GROWTH BY SECTOR
YEARLY ESTIMATED EPS GROWTH BY SECTOR
DOMESTIC VS INTERNATIONAL EQUITY [ QUARTERLY IN BILLIONS]
FLOWS BY ASSET CLASS [ QUARTERLY IN BILLIONS]